Quantitative Relationship:
Methods;
Absorption Spectrum:
One Dalton is equivalent to the Atomic weight of a Hydrogen atom.
The average mol. wt of amino acids is = 105 –110 Daltons;
Absorption of light by nucleotides at UV range is due to the presence of heterocyclic rings with double bonds.
Absorption of light by proteins at UV range is due to the presence of aromatic amino acids, like Tryptophan, Tyrosine, Histidine, to some extent Phenylalanine also contributes to absorption spectrum. The said amino acids have heterocyclic rings with one or more double bonds, it is these features that cause the molecules to absorb light at a particular wavelength, and i.e. at 280nm in this case the above said amino acids. Absorption of light by DNA or RNA is due to the presence of heterocyclic rings of N-bases.
Absorption spectrum can be performed by using spectrophotometers. There are a variety of such intruments.
One OD of ds-DNA at 260nm (1 ml cuvette) amounts to 50mg / ml, while one OD of ssDNA at 260nm is = 33ug/ml, but one OD of ss-RNA at 260nm is equal to 40mg /ml.
If the 260/280 ratio of DNA is 1.8; the quality of DNA is good, but if it is more than 1.8 then it is contaminated with RNA; or if the ratio is less that 1.8 then it is contaminated with proteins. If the ratio between 260 and 280 of RNA is 2, the quality is good.
Protein quantity measurement can be done by using absorption spectrum at 280nm and ratio at 280:200 or 210.
Optical measurement is not that accurate, hence prepare a standard graph and use it for determining the concentration. Use blank to adjust the D to zero.
Proteins in solution absorb ultraviolet light with absorbance maxima at 280 and 200 nm. Amino acids with aromatic rings are the primary reason for the absorbance peak at 280 nm. Peptide bonds are primarily responsible for the peak at 200 nm. Secondary, tertiary, and quaternary structure all affect absorbance, therefore factors such as pH, ionic strength, etc. can alter the absorbance spectrum.
[Protein] (mg/mL) = A280nm /(Ε 280nm x (cuvette path length in cm))
Concentration = Absorbance at 280 nm divided by absorbance coefficient
Signals in the region from 250-270 nm are attributable to phenylalanine residues, signals from 270-290 nm are attributable to tyrosine, and those from 280-300 nm are attributable to tryptophan. Disulfide bonds give rise to broad weak signals throughout the near-UV spectrum.
Near-UV CD spectra require about 1 ml of protein solution with an OD at 280 nm of 0.5 to 1 (which corresponds to 0.25 to 2 mg/ml for most proteins).
Tryptophan and tyrosine absorb ultraviolet light strongly at 280 nm. Peptide bonds are measured at 200nm.
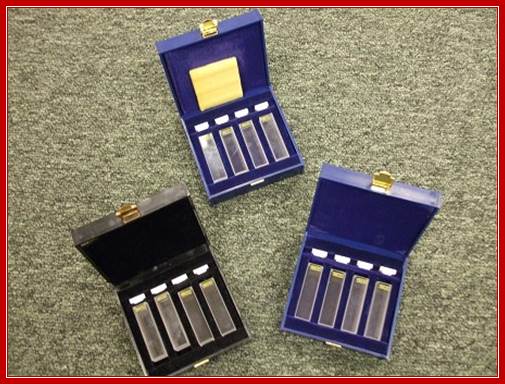

Cuvettes used for measuring OD; http://www.sciencebuddies.org/

UV-Visible spectrophotometer; http://www.usinenouvelle.com/

Sophisticated Spectrophotometer; https://nationalvetcontent.edu.au
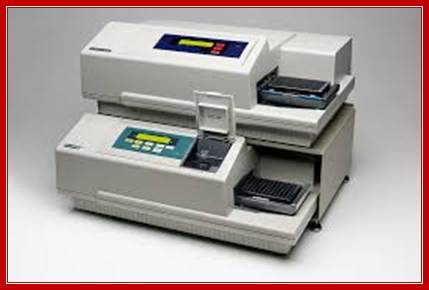
Spectramax 190 absorbance microplate reader; http://www.moleculardevices.com/
Principles of Spectrophotometry
Much of what we know about the photosynthetic apparatus was learned through spectroscopy—that is, measurements of the interaction of light and molecules. Spectrophotometry is an important branch of spectroscopy that focuses on the technique of measurement. Here we will examine four topics: Beer's law, the measurement of absorbance, action spectra, and difference spectra.
Beer's Law
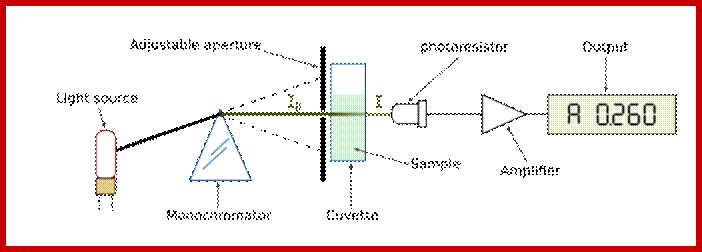
An essential piece of information about any molecular species is how much of it is present. Quantitative measures of concentration are one of the cornerstones of biological science. Of all the methods that have been devised for measuring concentration, by far the most widely applied is absorption Spectrophotometry. In this technique, the amount of light that a sample absorbs at a particular wavelength is measured and used to determine the concentration of the sample by comparison with appropriate standards or reference data. The most useful measure of light absorption is the absorbance (A), also commonly called the optical density (OD) (Web Figure 7.1.A). The absorbance is defined as A = log I0 / I where I0 is the intensity of light that is incident on the sample and I is the intensity of light that is transmitted by the sample.
|
|
|
Web Figure 7.1.A Definition of absorbance. A monochromatic incident light beam of intensity I0 traverses a sample contained in a cuvette of length (l). Some of the light is absorbed by the chromophores in the sample, and the intensity of light that emerges is I. intranet.tdmu.edu.ua |

The absorbance of a sample can be related to the concentration of the absorbing chemical species through Beer's law:
A = ε cl
where c is concentration, usually measured in moles per liter; l is the length of the light path, usually 1 cm; and ε is a proportionality constant known as the molar extinction coefficient, with the units of liters per mole per centimeter. The value of ε is a function of both the particular compound being measured and the wavelength. Chlorophylls typically have an ε value of about 100,000 L mol–1 cm–1. When more than one component of a complex mixture absorbs at a given wavelength, the absorbance due to the individual components are generally additive.
The Spectrophotometer;
The absorbance is measured by an instrument called a spectrophotometer (Web Figure 7.1.B). The essential parts of a spectrophotometer include a light source, a wavelength selection device such as a monochromator or filter, a sample chamber, a light detector, and a readout device, usually also include a computer, which is used for storage and analysis of the spectra. The most useful machines scan the wavelength of the light that is incident on the sample and produce, as output, spectra of absorbance versus wavelength, such as those shown in textbook Figure 7.7.
|
|
|
Schematic diagram of a spectrophotometer. The instrument consists of a light source, a monochromator that contains a wavelength selection device such as a prism, a sample holder, a photodetector, and a recorder or computer. The output wavelength of the monochromator can be changed by rotation of the prism; the graph of absorbance versus wavelength is called a spectrum. Laura-Nadine Schuhmacher; http://bitesizebio.com/ |
Action Spectra;
The use of action spectra has been central to the development of our current understanding of photosynthesis. An action spectrum is a graph of the magnitude of the biological effect observed as a function of wavelength. Examples of effects measured by action spectra are oxygen evolution (Web Figure 7.1.C) and hormonal growth responses due to the action of phytochrome (see Chapter 17 of the textbook). Often an action spectrum can identify the chromophore responsible for a particular light-induced phenomenon. Action spectra were instrumental in the discovery of the existence of the two photo systems in O2-evolving photosynthetic organisms.
|
|
|
Web Figure 7.1.C An action spectrum compared to an absorption spectrum. The absorption spectrum is measured as shown in Web Figure 7.1.B. An action spectrum is measured by plotting a response to light such as oxygen evolution, as a function of wavelength. If the pigments used to obtain the absorption spectrum are the same as those that cause the response, the absorption and action spectra will match. In the example shown here, the action spectrum for oxygen evolution matches the absorption spectrum of intact chloroplasts quite well, indicating that light absorption by the chlorophylls mediates oxygen evolution. Discrepancies are found in the region of carotenoid absorption, from 450 to 550 nm, indicating that energy transfer from carotenoids to chlorophylls is not as effective as energy transfer between chlorophylls. http://6e.plantphys.net |
|
|

Some of the first action spectra were measured by T. W. Engelmann in the late 1800s (Web Figure 7.1.D). Engelmann used a prism to disperse sunlight into a rainbow that was allowed to fall on an aquatic algal filament. A population of O2-seeking bacteria was introduced into the system. The bacteria congregated in the regions of the filaments that evolved the most O2. These were the regions illuminated by blue light and red light, which are strongly absorbed by chlorophyll. Today, action spectra can be measured in room-sized spectrographs in which the scientist enters a huge monochromator and places samples for irradiation in a large area of the room bathed by monochromatic light. But the principle of the experiment is the same as that of Engelmann's experiments.
Absorption maximum of Nucleotides:
Average Mol.wt of dNTP = 486 Daltons:
dATP at 259 nm = Mol.wt = 491.2 Daltons
dCTP at 271 nm = Mol.wt = 467 Daltons
dGTP at 253 nm = Mol.wt = 507 Daltons
dTTP at 267nm = Mol.wt = 482.2 Daltons
Average Mol.wt rNTPs = 499 Daltons:
rATP is 259 nm = Mol.wt = 507.2 Daltons
rCTP is 271 nm = Mol.wt. = 483.2 Daltons
rGTP is 253 nm = mol wt = 523.2 daltons
rUTP is 262 nm = Mol.wt = 484.2 daltons
A 100bp long DNA coding for 33 aa produces a protein of Mol.wt = 37 KD.
1pg of DNA = 6x10^11 daltons = 0.978x10^9 bp.
1 pg of E.coli DNA (4.6x10^6 bp long) = 3000 copies.
1 E.coli DNA of 4.6x10^6 bp long is = 0.00455 pg.
Human genome of 3x10^9 bp long DNA = 3pg,
1 ug of human ds DNA = 10^6 molecules,
1 ug of ds 1000bp long DNA = 1.52 p mole = 9.1x10^11 molecules,
1 pg of average length ie.2000ntd long = 1.93x10^9 ntds
1 pg of ds RNA or DNA = 0.978 x 10^9 bp,
1 pg of mRNA (of 2000 ntds long) = 9.65x10^5 molecules,
1 pmol of 1000 bp long dsDNA = 0.66ug,
1 pmol of 1000ntd long ssDNA = 0.33ug.
1 pmol of pUC 18/19 plasmid DNA = 1.77 ug
1 pmol M13 18/19 ss DNA = 4.78 ug,
1 ug of 1000 bp long ds DNA = 1.52 pmols = 9.1x10^11 molecules,
Lambda DNA 48562 bp long, 1 ug of it = 0.03 pmols = 2.1x10^10 molecules, 1 pmol of Lambda ds DNA =32.01 ug,
pBR 322 plasmid DNA = 4361 bp, 1 ug of it = 0.35 pmols = 22.1x10¹¹ molecules,
pUC 18/19 plasmid DNA = 1 ug of it = 0.57pmols = 3.4x10¹¹ molecules,
M13 18/19 plasmid DNA 7250 bp long, 1 ug of it is = 0.21 pmols = 1.3x10¹¹ molecules,
One map unit = it is a region of chromosome that can undergo recombination with a frequency of 50%, which can also refer to a length q which can be measured in terms of number of base pairs. Map units are referred to as Morgan units. One Morgan unit = 1x10^6 bp.
Molar Values:
1M = 6.02x10^23 molécules/liter
1mM = 6.02x10^20/per liter,
1uM = 6.02x10^17/ per liter
1nM = 6.02x10^14/ per liter
1pM = 6.02x10^11/ per liter
1fM = 6.023x10^8/per liter
1aM = 6.02 x 10^5/ per liter
Molecular Weights:
1ug = 10^- 6 gm,
1ng = 10^ - 9 gm,
1pg = 10^ -12 gm,
1fg = 10^ -15 gm,
1ag = 10^ -18 gm.
1gm = 10^3 mgs,
1kg = 10^ 3 gms
Some Numbers:
1mega = 10^6
1Giga = 10^9,
1Googaloo = 10^100,
1tera = 10^12 (1 Trillion),
1Quadrillion = 10^15,
1Octillion = 10^27,
1Centillion = 10^ 303.
1gm Mol.wt of a substance dissolved in water and then made to 1 liter is 1 Molar solution.
1gm molecular wt substance dissolved in 1 liter of water is 1 Molal solution.
1Normal solution =
1Equivalent weight solution =
Calculations for determining the concentration:
Sample OD at lambda max = Molar concentration.
Standard OD at lambda max for 1 M/1 ml = Mol.wt of ds DNA (= no. of base pairs) x average Mol.wt of a base pair.
1 pg of DNA (ds) = 6.1x10^12 (?) daltons = 978x10^6 bp or 0.978x10^9 bp.
Human cells (2n) contain 3.5x10^12 daltons wt DNA, that is equivalent to = 174 cm.
Total number of cells in human body is about 10^14 = 100gms of DNA = 2.5x10^10 km, whose length is more than 100 times the distance between the sun and earth.