Miscellaneous Techniques
1. Nested deletion analysis:
A cloned DNA can be subjected to deletions from both ends of the molecule. Nested deletions can be used to analyze and identify the promoter and it can use for drastic deletion mutations.
For example a segment of DNA has been cloned and one suspect the fragment has promoter elements. If this fragment has promoter elements which part of the fragment contains functional region. This can be analyzed by deletion analysis.
---II------P-\/DNA------------II-------lac-Z alpha--------Ttr-I
P/DNA = Promoter containing DNA? !
Lac-Z alpha = Reporter gene.
----II--- = Multiple restriction sites.
A cloned DNA, whatever it may be, is transcribed when the DNA is in right proximity to the promoter. Promoter is the region of the DNA that contains sequence elements that is recognized by the transcriptional factors and the RNA-polymerase and they bind tightly and initiate transcription at a predefined start point.
In the above case a known functional gene has been placed next to the DNA segment which is supposed to have promoter components. If the promoter components are in right positions so as to initiate transcription of the reporter gene, by expressing this gene in a bacterial system which provides the omega component for the functional protein Lac-Z beta Galactosidase. The expression can be visually observed by using X-Gal as the substrate. If the DNA that is placed next to the Lac-Z alpha is not in the right context then there is no transcription and even if transcription takes place, translation does not work. So in order to find out the region or the part that acts as promoter is identified by nested deletion protocol. Once identified the segment is then is ligated next to the reporter gene. This will give detailed promoter analysis and it also provides the strength and efficiency of the promoter.
First the putative promoter DNA is cut at the restriction site that is abutting to the reporter gene in such a way it generates a 3’ recessive end towards the promoter DNA and a 5’ recessive end towards the reporter DNA.
In another experiment cut promoter DNA at its other end (the 5’ end) in such a way it generates 3’ recessive end in the promoter DNA and 5’ recessive end in the vector DNA.
Such DNAs are taken in separate tubes, reaction buffer is added. Then required concentration of bacterial 3’exonuclease is added and allowed to the enzyme to delete the strand with 3’ recessive end. This enzyme has the property to recognize 3’ recessive end deletes the strand from that end nucleotide by nucleotide, at the rate of 50-100 nucleotides per minute.
Allow the reaction to proceed and remove the samples at set time intervals such as 2, 4, 6, 8 and 10 minutes or more, which means 200, 400,600, 800 and 1000 nucleotides are deleted respectively from whatever ends that one has provided.
Then the reaction mixture is stopped for furthering the reaction and the DNA in each tube is treated with S1 nuclease. This enzyme removes whatever single st5rand overhangs and generates blunt ends.
Such deleted DNA of the suspected promoter is ligated. Each of the samples is purified and each of them is used for transformation of desired bacterial cells such as JM109.
Whichever sample shows maximum Lac-z alpha activity is considered as the DNA fragments that have perfect promoter elements for high-level expression.

Sp3 regulates Fas expression in lung epithelial cells; Huiling PANG, Kathleen MIRANDA and Alan FINE; http://www.biochemj.org/
Such DNAs can be used for sequence analysis to find out, what are the sequence elements and at what distance they are located from the start site. This way it is possible detect promoter and other regulatory elements in the DNA such as enhancer elements, repressor elements and activator sequences.
S1 Nuclease treatment removes all the over hangs and creates blunt ends, which can be ligated and tested for the expression. The same can be sequenced to identify sequence elements.
Blue colored lines: Indicate the promoter-DNA is deleted segment by segment from 5’ end in one set and it is deleted from 3’ end of the DNA in another set. Then using S1 nuclease blunts them. And the same are ligated to vectors and the recombinant DNA is used for transformation. Those colonies that express reporter genes are selected and the promoter region is sequenced to identify sequence elements.
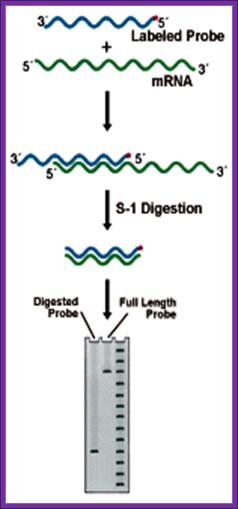
2. S1 Nuclease Mapping:
This techniques though it has few flaws, even though it is used to find out the 5’ and the 3’ ends of a particular transcripts in the cell.
Prepare a DNA fragment accounting for the said mRNA species. The length of the DNA should be from the start of the initiation and end of the transcript, which is the start of the poly-A segment.
In one set, label the DNA at the 5’ end and in another set label the DNA at its 3’ end with 32P* using polynucleotide kinase. In this kinase reaction kinase perform labeling at 5’ at both ends. After labeling the 3’ end it is cut using a specific restriction enzyme and purification of the labeled DNA, which is used for S1 nuclease mapping.
To label the 3’ end the DNA with overhangs are filled by T4 DNA polymerase and using specific restriction enzymes chaps off the 5’ end of the DNA. The labeled DNA is melted single strands before use.
Isolate total poly-A RNA or any other RNA that one wants to analyze and distribute the same into two tubes one for analyzing the 5’ end of the RNA and another for analyzing 3’ end of the RNA.
To one tube add 5’ labeled ssDNA and the other tube add 3’ labeled ssDNA and hybridize in hybridizing solution at high temperature 52-55° C (called stringent Hybridization).
Then the reaction mixture is treated with S1 nuclease which removes the over hangs from both sides.
The blunted RNA-DNA hybrids are melted to single strands and then sequence the same to get 5’ end and 3’ end sequences of the mRNAs. However the S1 nuclease occasionally does not remove the over hangs completely and some times the 5’ ends are recessed. Once in a while it may cut the Hybrids at places where annealing is not complete. So another method has been employed called Primer extension method.
|
|
|
|
S-1 mapping of a transcription start site. The length of the labeled probe fragment remaining after digestion reflects the distance between the 5' end of the probe and the 5' end of the RNA (the start site). Lanes: 1) Experimental, 2) Probe control, 3) Sequence ladder. |
S-1 mapping of an intron site. The nuclease digests the unhybridized intronic DNA, which is not represented in the RNA. The size of the labeled fragment remaining indicates the distance between the 5' end of the probe and the intron position. Lanes: 1) Experimental, 2) Probe control, 3) Sequence ladder; https://www.nationaldiagnostics.com/ |

Primer extension method:
In order to avoid S1 nuclease problem, one can use designed labeled primers for specific segment and hybridize the same to RNA and extend the primer using Reverse transcriptase. This provides the 5’ end completely. Then sequence it find the 5’end nucleotides.
5’-------------------------------------------------------------AAAAA (A)n
3’v---------5’** Primer
V
5’--------------------------------------------------------------AAAAAA (A)n
3------------------------------------------------------------v--primer----5’
DNase1 Foot printing:
This method is used for identifying any deletion or addition or translocation mutations. In this process Ribonuclease-A is used. This enzyme has the ability to cleave RNA in RNA-DNA hybrid, if the RNA segment is looped out of the sequence.
Prepare the desired RNA from cloned DNA using T7 or SP6 promoters and label them during the synthesis.
Foot printing: http://users.rcn.com/
5’*---------------------------------3’ labeled at 5’ end.
![]() 3’-----------------------------------
DNA
3’-----------------------------------
DNA
5’*-----------v-------------v------ RNA
Hybridize labeled RNA with a known functional DNA. If there are any deletions in the gene, mismatch leads to the looping out of the RNA.
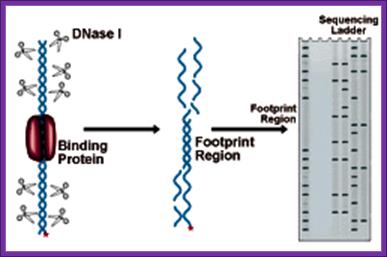
Treat with Ribonuclease-A, which cuts the looped RNA, which will appear as two or three bands on gel electrophoresis. If there are unmatched and loops, one will get 3 bands. Instead of using the RNase-A one can use osmium tetra oxide and Hydroxylamine to cleave the looped RNA at C and T nucleotides.
This method will detect the defect in the genetic DNA.
Graciela M. PANZETTA-DUTARI, et al:http://www.biochemj.org/
Single strand conformation polymorphism:
Detecting a single nucleotide change, for example the ‘A’ nucleotide is replaced by ‘T.
Say CA*A has changed to CT*A. This cannot be easily detected by PCR amplification or by S1 nuclease mapping or by RNase-A foot printing. But this can detected by what is called single strand conformational polymorphism (SSCP).
Take the suspected DNA and design primers for the 5’ end and for the 3’ end of the DNA.
Label the 5’ end primers only.
Anneal the primers to the said DNA.
Using Taq polymerases amplify the DNA.
Then run the amplified DNA on a native polyacrylamide gel.
|
CAA / CAA=2n |
CAA / CTA=2n |
CTA / CTA=2n |
|
|
|
|
|
|
|
---- |
---- |
|
CAA |
|
|
---- |
----- |
CTA |
|
|
---- |
----- |
GTA |
|
|
|
|
|
|
----- |
----- |
|
GTT |
|
|
|
|
|
|
|
|
|
|
|
|
|
|
|
This change in the movement of the single strands in electrical field is due to conformational changes, which stems from the nucleotide sequence. A change in one nucleotide makes lot difference in the mobility, thus it exhibits polymorphism.
Blotting Techniques:
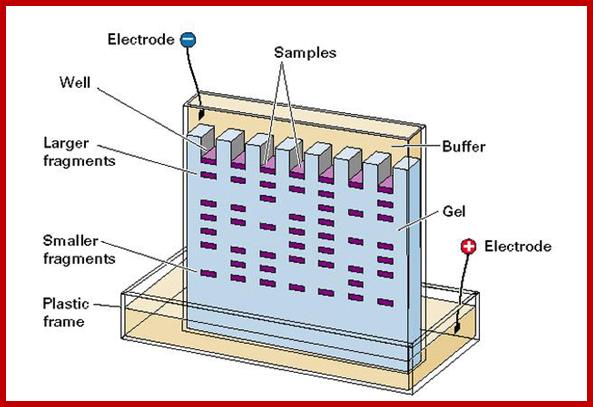
These are very important techniques to characterize gene and gene products, such as DNA, RNA and proteins. An unknown DNA fragment can identified using a probe using blotting protocol, called southern blotting; it is actually developed by Dr. Southern, Later the developed northern blotting to characterize RNA transcript. For protein analysis, people developed western blotting techniques.
Important requirement for blotting techniques is electrophoresis equipments, and its accessories. There three major kinds of blotting techniques, southern, northern and western types. For separation of RNA, DNA and proteins, people use gels with specific pore size, through which the said molecules move under electrical field. Depending upon the sizes they move differentially. High mol.wt threads moves slowly and low mol.wt move faster. The gels used are Agarose and Acrylamide, where Agarose is used for separation of RNA and DNA and Acrylamide is used for proteins, DNA sequencing and DNA profiling. Based on the type of the apparatus used they are called horizontal gel systems and vertical gel systems. There are few new systems such as capillary electrophoresis used for large scale DNA sequencing and Difference gel electrophoresis (DGE) for differential separation.
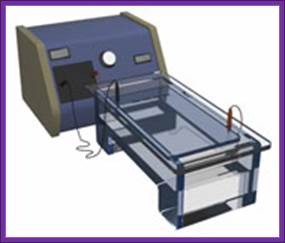
Horizontal Gel Electrophoresis system; http://www.nature.com/

http://www.sigmaaldrich.com
http://zoologynotesmu.blogspot.com/
Vertical Gel electrophoresis
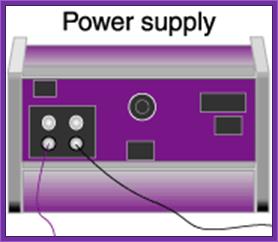
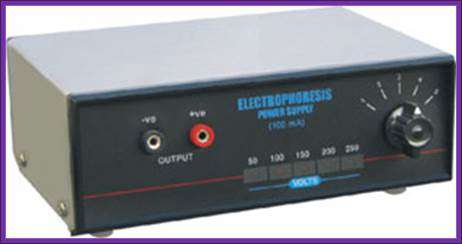
Power supply for electrophoresis; http://www.labyindia.com/
Southern Blotting:
This is an elegant method by means of which it is possible to identify a piece of DNA, which may be a gene or a part of gene. The method, in theory, is simple, but takes long hours and lot of manual labor. First of all, you have to have a probe, which can be labeled DNA fragment, or an oligo nucleotide of known sequence or a specific RNA.
Restriction Fragments separate as individual bands; http://www.web-books.com/
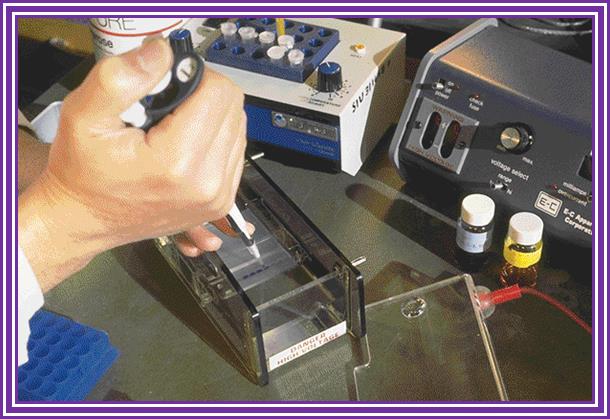
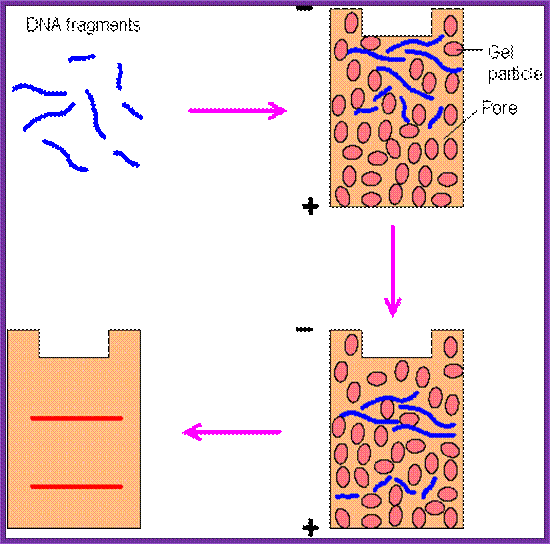
Isolate total or cloned DNA, fragment it with a restriction enzyme, use rare cutting RE, and run it on Agarose gel (0.7%), with EtBR (Ethidium Bromide), which intercalates into to DNA; when it binds it fluoresces under UV. Observe under UV light, you find it as a smear if it is total genomic RNA, you won’t see any specific fragments. But a cloned DNA fragments are visible as bands.
Take the gel place it on Whatman paper No.1, which is placed on an elevated glass or plastic container, so the sides of the paper can be immersed in a solution. The Whatman paper acts as the wick and transfers the liquid in to the gel from bottom. Now you place a Nitrocellulose membrane or Nylon membrane, and then place a bunch of filter papers over the membrane. Over it place a weight. Now add the solution for transfer of the DNA on to the membrane. Leave it for 16-24 hrs. Take out the membrane; don’t forget to mark the ends and sides of the membrane. You can check the membrane with UV light whether or no the DNA is transferred or not. This is the end of blotting.
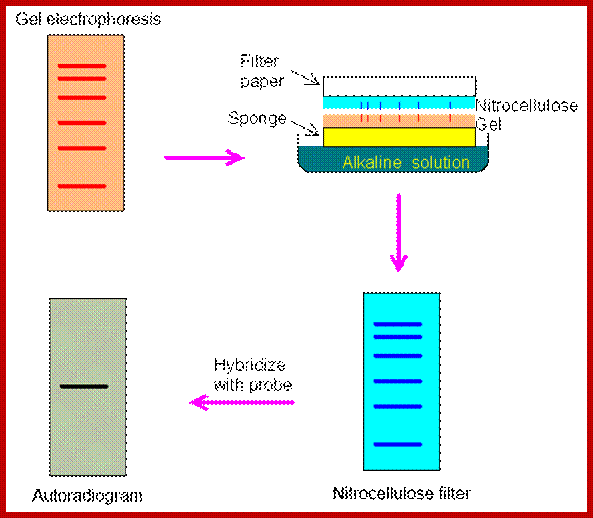
Take the membrane air dry it, then place it in a solution that denatures DNA, (use 5M NaCl), after 3-5 minutes, take out the membrane and neutralize it with Tris buffer. Now the denatured DNA has to bind to the membrane (if it is Charged Nylon membrane don’t bother), other wise if it is NC membrane, it has either backed at 90^c under vacuum or it has be cross linked under UV light.
Such a membrane is placed in plastic sealing bags. And place it in glass contained in pre hybridization buffer and gently rock it for 2-3 hrs or more. Meanwhile prepare the labeled probe, it can be a ssDNA, RNA or an oligo; suspend in a hybridization buffer. Now pour off the liquid and add hybridization buffer containing the probe, make sure there are not many air bubbles in the bag. Place the bag in a water bath with shaker facility, and gently rock it for 36-48hrs. Afterwards, take out the membrane wash it 2-3 time times in Tris buffer, gently to remove all the probes that are not hybridized with DNA. Airs dry the membrane and expose it to an X-ray film (in dark). If the probe is very hot, expose it for few hrs, otherwise keep it for 12hrs or so at -20^C. Then develop the X-ray film and dry it and observe the bands. The DNA fragment that is complementary to that of the probe stands out clearly. Using the position of the band, one can elute the band which was run parallel to that used for hybridization. Remove EtBR from the DNA using isopropanol and use it cloning and sequencing.
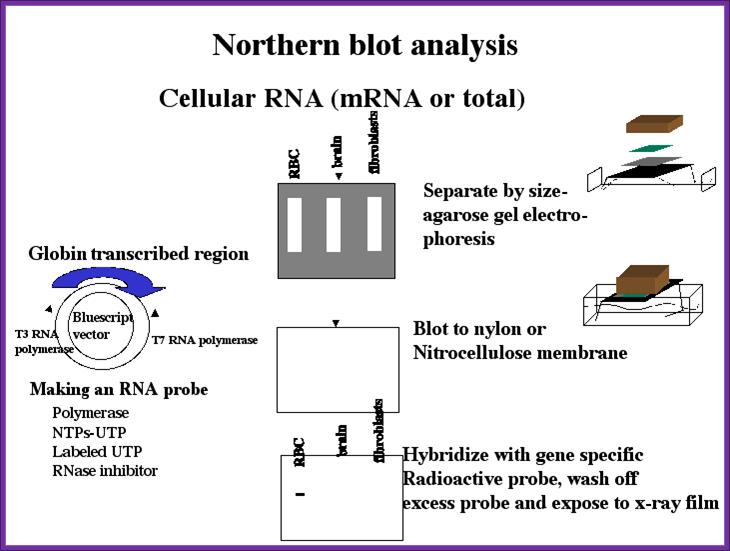
Northern Blotting:
The protocol for RNA is more or less same but one has to be careful of RNase. Whatever RNA you have prepared is heated to 60^C for 5 minutes and place it in Glyoxal or formaldehyde solution (both should be distilled and ultra pure. Run the RNA gel and transfer it to a NC membrane.

Southern/northern blot transfer assembly; http://www.sigmaaldrich.com
You can check under UV light. Prepare the membrane for hybridization with a probe. The probe can be either a DNA fragment with known sequence or known oligos. Hybridize and expose to the film and check the band. Once you identify the band use the duplicate and cut out the band and elute the RNA and prepare cDNA and clone it. Such clones can be used for sequencing or transcription and translation. Note all equipments, solutions used are autoclaved or glass vessel to backed at high temperature over night. And the solutions can contain RNasin and inhibitor of RNase.
Northern blotting; www.seo-traffic-ranking.info/pages
Sothern hybridization technique https://cellularphysiology.wikispaces.com
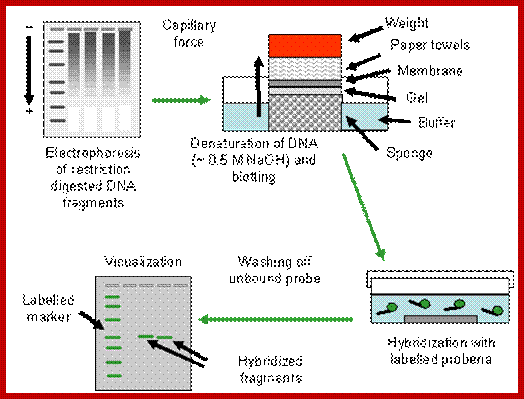
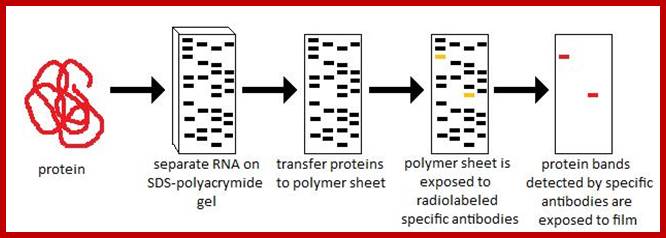
Western blotting:
Western blot analysis of proteins; http://microbeonline.com
http://www.sci.sdsu.edu
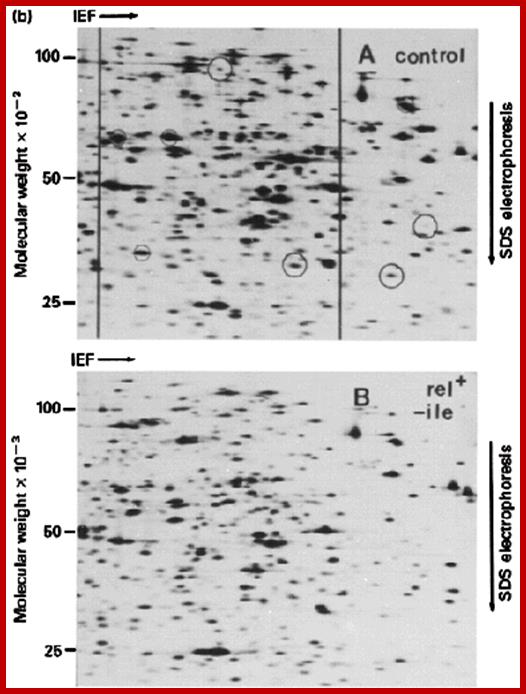
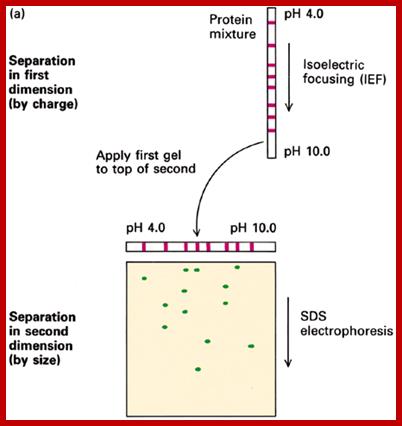
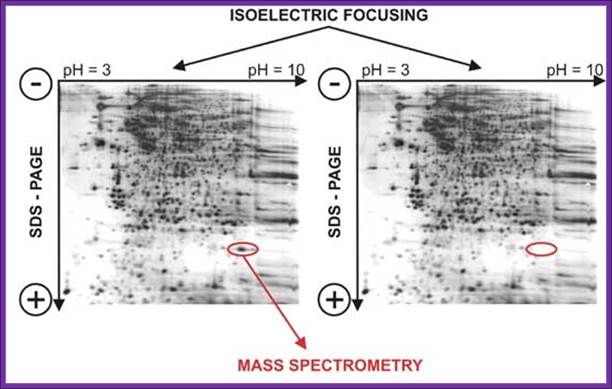
Final gel has a complex mixture or proteins separated by pI along the horizontal axis and by log M along the vertical axis; Can resolve thousands of spots (proteins) by this technique. Analysis is now automated by computer so that one can do 2D gels on whole cell extracts and monitor how each protein changes during: a) Development; b) Transformation; c) Excitation -- e.g. by a hormone etc. http://www.sci.sdsu.edu
https://www.slideshare.net
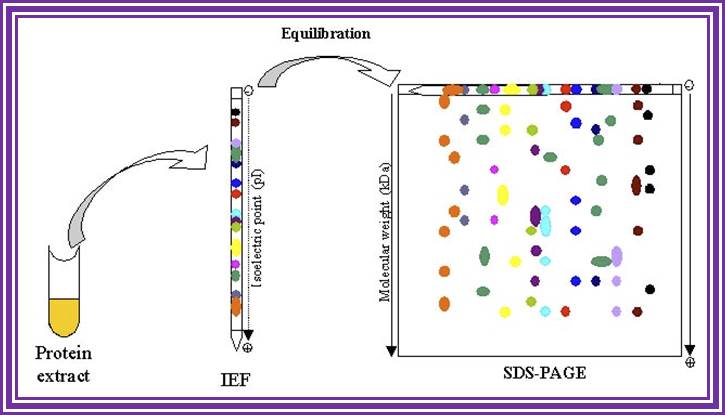
The first run of proteins is in tubes and separated by Isoelectrofocussing. Proteins are separated on the basis of isoelectric point of the said proteins. Each bad may contains the same Isoelectric point. Then the gel is placed on regular Acrylamide gradient gel and run. The proteins separated under Isoelectrofocussing (clusters in each band) are now get separated based on their molecular weight.
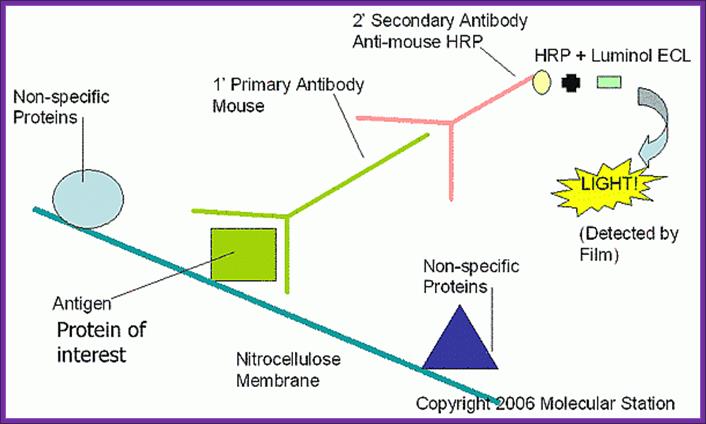
This protocol is used for identifying a specific protein or proteins. In order to identify a specific protein expressed under certain conditions, proteins have to be isolated using proper protocols and the same are separated using SDS-PAGE or native gel. The can be 10% or 14% gradient gel. Run the gel with duplicate samples. Cut out one sample and stain it with coomassie blue. The other part of the gel is neutralized and transferred on to NC membrane or (?) by protein transfer blot method. Take out the membrane and neutralize the membrane. Place it is glass vessel and add pre hybridization buffer containing powdered milk to avoid non specific binding. Then add specific IgGs. Leave it overnight in a cold room. Then wash to remove all those antibodies not bound to proteins. The treat the membrane with anti-antibody conjugated with horse radish alkaline phosphotase. And add BCIP and tetrazolium blue. Wherever the IgGs are bound the anti-antibody develops color. Wash the membrane and dry it and observe the spots.
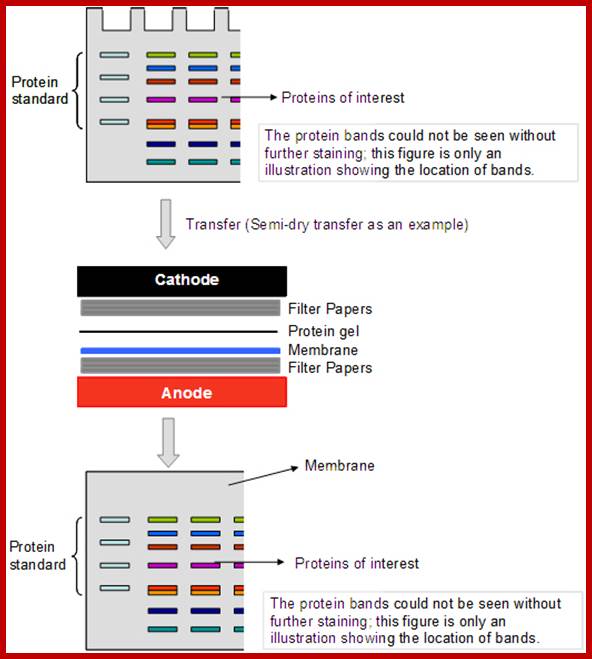
Electro blotting technique; http://blog.ptglab.com
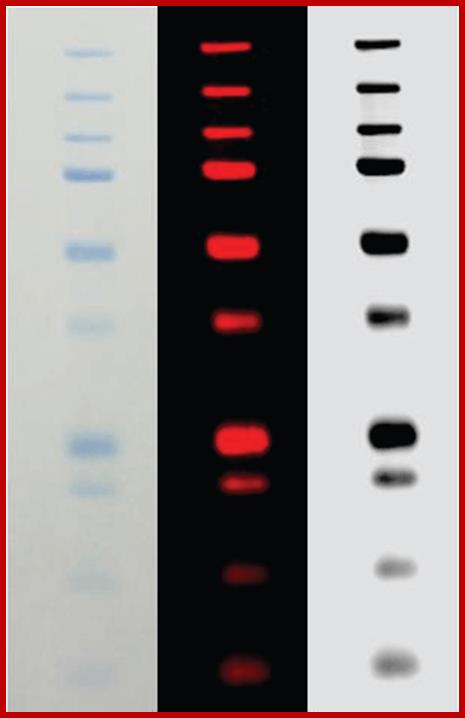
Fluorescent labeled protein bands; https://www.licor.com
www.bios-project.blogspot.com
Southern-Western blotting:
Combination of southern and western blot method one can use both DNA and proteins to identify, which protein is bound to which part DNA fragment. This protocol is called southern-western blotting. Run the required DNA fragments, blott it on to NC paper; labeled Protein is added and allowed to bind. Then wash and expose to X-ray film. The labeled protein shows up with a DNA fragment to which it was bound, that shows the proteins affinity to bind. In this diagram 1 and 2 are bound by specific proteins.

Diagram of far-Western blot to analyze protein-protein interactions. In this example, a tagged bait protein is used to probe either the transfer membrane or a gel for the prey protein. Once bound, enzyme (horseradish peroxidase; HRP)-conjugated antibody that targets the bait tag is used to label the interaction, which is then detected by enzymatic chemiluminescence. This general approach can be adjusted, as shown in the Table below, by using untagged bait protein that is detected by antibody, biotinylated bait protein that is detected by enzyme-conjugated streptavidin, or radiolabeled bait protein that is detected by exposure to film. https://www.thermofisher.com
Pulse field gel electrophoresis:
In 1984, Schwartz and Cantor described pulsed field gel electrophoresis (PFGE), introducing a new way to separate DNA. In particular, PFGE resolved extremely large DNA for the first time, raising the upper size limit of DNA separation in agarose from 30-50 kb to well over 10 Mb (10,000 kb).

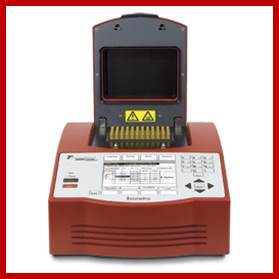
Equipment with Power supply; ;http://www.biometra.de

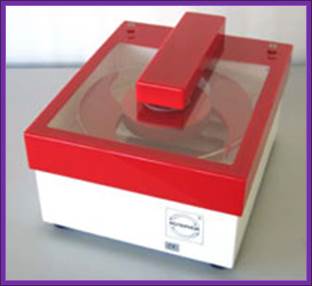
PFGE; www.wordpress.com
During continuous field electrophoresis, DNA above 30-50 kb migrates with the same mobility regardless of size. This is seen in a gel as a single large diffuse band. If, however, the DNA is forced to change direction during electrophoresis, different sized fragments within this diffuse band begin to separate from each other.
Equipment with Power supply; http://uvmgg.wikia.com
Example of a real PFGE; drug resistant Staphylococcus aureus.www.wordpress.com

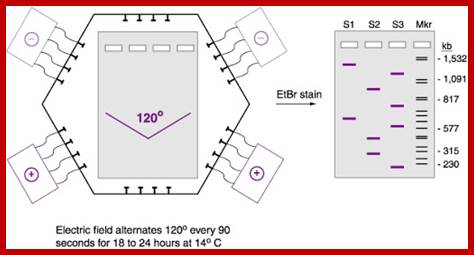
Pulse field gel electrophoresis: A. A short DNA molecule (100 kb) and B. a long DNA molecule (300 kb) subjected to 120° PFGE. The field pulls the molecules alternatively towards the lower right and left in the direction of the arrows. Successive molecular conformations, 2 s apart, are colored differently and shifted downward for clarity. Electric field, 6 V/cm; pulse time, 10 s.
PFGE allows investigators to separate much larger pieces of DNA than conventional agarose gel electrophoresis. In conventional gels, the current is applied in a single direction (from top to bottom). But in PFGE, the direction of the current is altered at a regular interval as shown in the animated gif below.
The gray box is the gel, the six sets of 4 black lines represent the 3 pairs of electrodes. Initially, the gel is empty but soon Whole chromosomes mixed with blue loading dye will be placed into the wells. Then the current will be turned on and the direction of the current will change in a regular pattern. This is repeated until the loading dye reaches near the end of the gel Then the gel is soaked in a solution containing ethidium bromide which fluoresces orange when bound to DNA.
Thistle scientific Instrument:
http://www.thistlescientific.co.uk
http://www.thistlescientific.co.uk
- Separation of very large DNA molecules (up to 6Mb)
- Exceptional resolution
- Electrode rotor allows free choice of electrical field angles
- Software included Gel to Gel visual comparison
Rotating
Field Electrophoresis (ROFE):
Pulsed Field Electrophoresis with the Rotaphor allows separation of DNA beyond
the 50kb limit of conventional Agarose electrophoresis. Thanks to the freely
rotating electrode rotor, electrical fields can be applied in any angle. To
achieve homogeneous fields, each of the two main electrodes are flanked by 2
sets of secondary electrodes.
Flexibility.
Due to the unique design of the Rotaphor system, all common techniques for
separation of large DNA molecules can be applied. This includes methods like
CHEF, FIGE, PAGE and naturally ROFE. In contrast to conventional PFGE systems
with fixed electrodes, the Rotaphor system allows any field angle, providing a
reproducible, homogeneous electrical field.
Buffer Management.
Since typical PFGE gels run for many hours (up to several days), the buffer
must be cooled and circulated. Therefore the Rotaphor System is connected to a
cooling thermostat. The Rotaphor system has a built-in pump that provides a
homogeneous buffer flow. Buffer temperature is precisely monitored and
controlled by the Rotaphor software.
Easy Control.
The Rotaphor system includes a PC (excluding monitor) which is used for
controlling the system. The Rotaphor 6.0 software provides 17 pre-set programs
for separation of various size ranges. Starting with the pre-set parameters,
new applications are quickly optimized. Gel images can be loaded into the
software and viewed along with the corresponding program. Thus the Rotaphor
software over time will not only be a control tool, but also a library of
successful experiments linked to the underlying separation parameters.
Samples subjected to PFGE
http://cdn.biologydiscussion.com
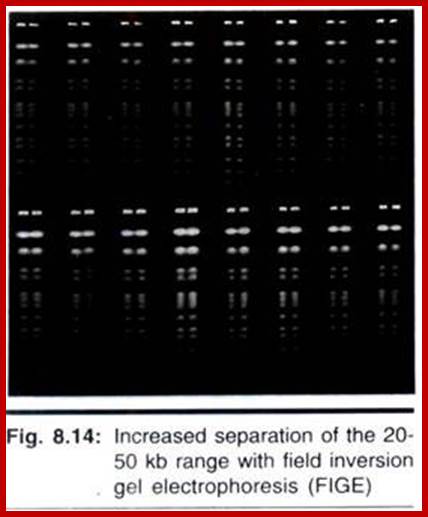
Increased separation of the 20-50 kb range with field inversion gel electrophoresis (FIGE). Run conditions: 230 V, 7.9 V/cm, 16 hrs., 50 msec. pulse, forward:reverse pulse ratio = 2.5:1, 1% GTG agarose, 0.5X TBE, 10 C.a) 1 kb ladder, 0.5-12 kb; b) Lambda/Hind III, 0.5-23 kb; and c) High molecular weight markers, 8.3-48.5 kb.

http://paramed.ir
Rotaphor
6.0.
Pulsed Field Gel Electrophoresis System for separation of high molecular DNA
(up to 6 Mbase). Thanks to the patented Rotaphor technology an unparalleled
resolution of high molecular DNA is achieved. The Rotaphor technology also
provides powerful separation of linear and circular DNA molecules.
Gel chamber.
• Freely rotating electrode rotor with 14 platinum electrodes (270° max angle)
• Integrated buffer circulation pump
• Internal cooling circuit for connection of an external thermostat
• Temperature sensor
• 2.4 l buffer volume
• Acrylic glass safety lid (automatic shut off when lid is lifted)
• Dimensions 35 cm x 47cm x 25cm (W x D x H)
Gel Tray.
• Adjustable feet for horizontal leveling
• 20 x 20 cm gel format
• 18 cm separation distance
PC (included).
• WIN XP
• 265 Mbytes RAM
• 40 Gbytes hard disk
• 40 x CDROM
• Control interface for Rotaphor electrophoresis chamber
• Installed Rotaphor 6.0 control software
Rotaphor
6.0 Software.
• 17 optimized programs for separation of samples from 100 bp up to 6 Mbase
• Easy creation of new programs (angle, Voltage, Pulse length)
• Programs can be linked to create complex separation pattern
• Program in- or decremental field vectors (linear or logarithmic)
• Program in- or decremental pulse length
• Program Voltage for Electrophoresis 0-225Volt (0 – 8,5 V / cm)
• Precise control of buffer temperature (5 – 22 °C)
• For each program a real gel picture can be loaded / displayed
• Convenient User administration
• Comprehensive online help
Power Supply.
• Rotaphor 6.0 Interface
• Voltage: 0 – 300 V
• Current: 0 – 450 mA
• Dimensions: 52 mm x 222 mm x 202 mm (H x W x D)
• Weight 1.7 kg
With each reorientation of the electric field relative to the gel, smaller sized DNA will begin moving in the new direction more quickly than the larger DNA. Thus, the larger DNA lags behind, providing a separation from the smaller DNA.
Currently, there are three models that attempt to describe the behavior of DNA during PFGE (reviewed by Chu, 1990), the biased reptation model (BRM), the chain model, and, most recently, the bag model
The simplest equipment is designed for field inversion gel electrophoresis (FIGE) (Carle, et al., 1986). FIGE works by periodically inverting the polarity of the electrodes during electrophoresis. Because FIGE subjects DNA to a 180� reorientation, the DNA spends a certain amount of time moving backwards. Only an electrical field switching module is needed; any standard vertical or horizontal gel box that has temperature control can be used to run the gel. Although more complex in its approach, zero integrated field electrophoresis (ZIFE) (Turmel, et. al, 1990) also falls into this first category.
Isoelectric focusing (Isoelectrofocussing technique).
It is used in separation of proteins based on the electric charges. It is a kind of zone electrophoresis. The ampholite solution used in the gel (IPG) preparation develops pH gradient. The immobilized gel has a pH gradient is obtained by the continuous change in the ratio of Immobilines. An Immobiline is a weak acid or base defined by its pK value.
Ampholytes are organic molecules especially amino acids that contain both acidic and basic groups (and are therefore amphoteric) and they exist as zwitterions at a certain pH range. The pH at which the average charge of the molecule is zero , it is known as isoelectric point. Ampholytes are used to establish a stable pH gradient for use in isoelectric focusing. Prime examples among the amino acids are lysine, arginine, glutamic acid and aspartic acid. Ampholytes are always amphoteric, since they can act as either acids or bases.
The pH gradient in IEF gels is generated by the inclusion of ampholytes, low molecular weight amphoteric molecules. A mixture of ampholytes is used, each having a different pI. Like protein molecules, the ampholytes migrate through the gel until they reach a region where the pH is equal to their pI. Unlike the proteins, the ampholytes are present in high enough concentration to change their local pH. The gel is set up with a uniform mixture of ampholytes throughout, and its anodic and cathodic ends are immersed in dilute acid and base respectively. Ampholytes near the ends of the gels will be positively charged near the positive electrode, and negatively charged near the negative electrode. They therefore begin to migrate into the gel, with the most charged (ie the ones furthest from their pI) moving the fastest. Over time they separate into zones of defined pH. If the ampholyte system is well designed, a smooth gradient of pH is created, with no abrupt charges, or "steps." Commercial systems are available in broad range (2 - 12 pH) or narrow range (extending 2 pH units across the gel (www. national diagnostic.com).

Isoelectic focusing; https://www.nationaldiagnostics.com
Isoelectric focusing employs a pH gradient extending the length of an electrophoresis gel. A protein stops migrating when it enters the zone in which the surrounding pH equals its isoelectric point, pI. At any other point in the gradient, the protein acquires a charge which causes it to migrate toward its pI (green and blue arrows).
When a gel is prepared in a narrow tube by using ampholytes, a gradient of pH is developed in the gel from 12 to 2 (?). When a sample of protein is placed and electrophoresed, proteins move. But stop movement when the electric charge of the protein is same as that of a region of the gel. At this isoelectric point the protein remains stagnant. As different proteins have different electric charges proteins separate and position at a particular isoelectric point. There can be more than one protein that has such isoelectric charges and remain as one band.
When this gel containing such protein bands are run on a second polyacrylamide gel proteins are separated on the basis of their molecular weights. This is the second dimension. Using isoelecrofocussing first and using SDS PAGE as second run it is possible to separate proteins on the basis of electric charges and molecular weight. Thus 100 to 500 proteins can separated and discerned. The second run can be made on gradient acrylamide gel. The following table gives an idea the density of the gel (in %) and the proteins separated on basis of their mol.wt.
|
% Gel |
M.W. Range |
|
7 |
50 kDa - 500 kDa |
|
10 |
20 kDa - 300 kDa |
|
12 |
10 kDa - 200 kDa |
|
15 |
3 kDa - 100 kDa |
Equipments used for electrophoresis; https://en.wikipedia.org

Electrophoretic gel apparatus with power supply

SDS-PAGE-Proteins are stained coomassie Blue. https://www.slideshare.net

First dimension; https://www.slideshare.net/
Proteins were first separated by electrophoresis according to charge. Isoelectrofocusing (IEF) was carried out with protein samples with an equivalent to an extract of 8 400 seeds, corresponding to about 150µg protein for all samples. Proteins from the various extracts were separated using gel strips forming an immobilized non-linear pH gradient from 3 to 10 (ImmobilineTM DryStrip pH 3-10 NL, 18 cm; Amersham Pharmacia Biotech). Strips were rehydrated for 14 h at 22°C with the thiourea/urea lysis buffer containing 2% (v/v) Triton X-100, 20 mM DTT and the protein extracts. IEF was performed at 22°C in the Multiphor II system (Amersham Pharmacia Biotech) for 1 h at 300 V and 7 h at 3500 V. Proteins were then separated according to size. Prior to the second dimension, the gel strips were equilibrated for 2 x 20 min in 2 x 100 ml equilibration solution containing 6 M urea, 30% (v/v) glycerol, 2.5% (w/v) SDS, 0.15 M bis-Tris, and 0.1 M HCl (Görg et al., 1987; Harder et al., 1999). DTT (50 mM) was added to the first equilibration solution, and iodoacetamide [4% (w/v)] to the second (Harder et al., 1999). Equilibrated gel strips were placed on top of vertical polyacrylamide gels [10% (v/v) acrylamide, 0.33% (w/v) piperarine diacrylamide, 0.18 M Trizma base, 0.166 M HCl, 0.07% (w/v) ammonium persulfate, 0.035% (v/v) Temed]. A denaturing solution [1% (w/v) low-melting agarose (Gibco BRL), 0.4% (w/v) SDS, 0.15 M bis-Tris, and 0.1 M HCl] was loaded on gel strips. After agarose solidification, electrophoresis was performed at 10°C in a buffer (pH 8.3) containing 25 mM Trizma base, 200 mM taurine, and 0.1% (w/v) SDS, for 1 h at 35 V and 14 h at 110 V. Ten gels (200 x 250 x 1.0 mm) were run in parallel (Isodalt system from Amersham Pharmacia Biotech). For each condition analyzed, 2D gels were made in triplicate and from two independent protein extractions (Arabidopsis Seed Proteome, 2D electrophoresis). http://www.nptel.ac.in/ http://www.creative-proteomics.com
http://www.seed-proteome.com
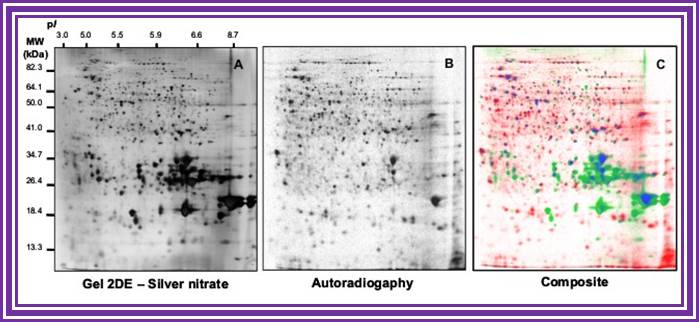
Comparison of 2DE profiles of total proteins revealed by silver nitrate (A) and proteins synthesized de novo and revealed by autoradiography (B). Proteins are extracted from germinating Arabidopsis seeds (24-h imbibition) on water and [35S]-Met. (A) 2DE gels stained with silver nitate. (B) Autoradiography of proteins radiolabeled in the presence of [35S]-Met. (C) Composite gel with protein spots shown in false colors. Red, proteins revealed by autoradiography but not by silver nitrate. Green, proteins revealed by silver staining but not by autoradiography. Blue, proteins revealed both by silver staining and autoradiography. Data from Rajjou L (2006, PhD thesis).