Restriction Site Mapping:
In making genomic library the DNA is cut with rare cutting enzymes and large fragments of the size of 100,000 to 1000, 000bp. They are ligated to vectors such as Pacmid or YAC vectors. For analyzing such a huge sized DNA and to identify a specific gene, first the DNA is subjected restriction enzyme cutting to locate the restriction sites in a sequence or what is called restriction site mapping. This is different from Restriction fragment length polymorphism.
For restriction site mapping one has to obtain DNA from single chromosome by pulse field gel electrophoresis. Then the DNA is cut and cloned. Then the DNA is released from one end of a clone and label the 5’ ends of the DNA. Then the other end is released by using another restriction enzyme. Thus the cloned DNA has only one with radioactive label. You should note which end is labeled.
Purify such DNA and dispense the same into say four tubes. One is used as the control. The other three are used to digest the DNA with specific Restriction enzyme. The digestion has to be controlled in such a way only one DNA molecule is cut only once. This type of digestion is called partial digestion. The heat inactivate the enzymes add sample loading buffer containing B.P blue (Bromophenol Blue) and X.cyanol. Heat to unwind secondary structure and load the same onto the Gel. Once the Xylene cyanol front reaches beyond the bottom end, stop the run. Dry the gel and autoradiograph the gel.
5’32`P-(r1)-10K(d3)--(bh1)-20K(r1)-(d3)-30K(bh1)-(r1)-40K3’
For understanding the principle let us assume the 5’ end is labeled with *32P. The R1 cuts at 05kbp, then at 20kbp, then at 35kbp. So it generates 3 fragments of 5, 20 and 35kbp labeled fragments. HinD3 produces fragments of 10, 25kbp labeled fragments. BamH1 produces 15, 30kbp labeled fragments. Only labeled fragments are detected.
|
|
R1 |
D3 |
H1 |
|
|
40kbp |
|
|
|
|
|
35kbp |
-- |
|
|
|
|
30kbp |
|
|
-- |
|
|
25kbp |
|
-- |
|
|
|
20kbp |
-- |
|
|
|
|
15kbp |
|
|
-- |
|
|
10kbp |
|
-- |
|
|
|
5kbp |
-- |
|
|
|
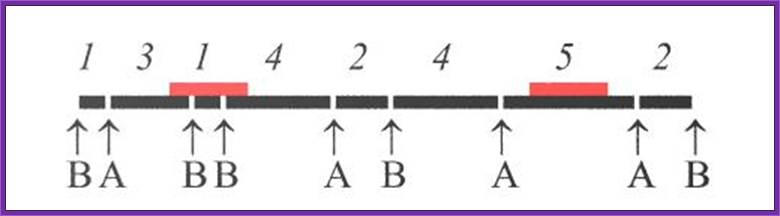
If one reads the sites from the bottom which is labeled 5’ end, the restriction sites read like 5’-R1----D3--H1---R1----D3---H1---R1-3’.
Using this knowledge one can clone each of the fragments and do more restriction site mapping and the same can be cloned and sequenced. Similarly other large sized clones can be mapped with restriction sites and sequenced. Then the sequences are placed in overlapping fashion and they can be aligned according the sequence similarity. This gives what is popularly called chromosomal walking. One can also use jumping genome library for chromosomal walking.
Restriction Site Mapping:
It is a very useful techniques, so one can analyze a DNA fragment where one use it for marking a position, they act as flag post for molecular biologists.
This technique along with end sequencing one can align fragments of DNA in a sequence, which is used for contigs alignment.

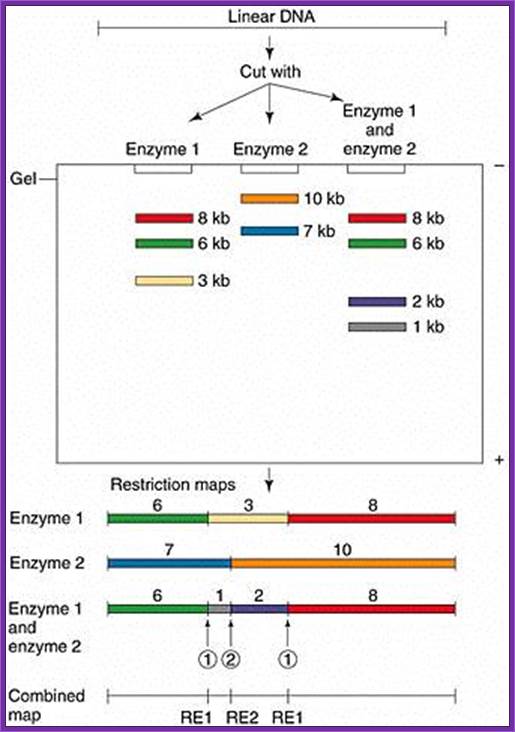
Cut the
DNA with each enzyme singly, and with all possible pairwise combinations.Lane-
1. pTut x BglII
2. pTut x BstEII
3. pTut x BglII + BstEII
4. pTut x EcoRV
5. pTut x BglII + EcoRV
6. pTut x BstEII + EcoRV
7. Lambda x HindIII: 23,130, 9416, 6557, 4361,
2322, 2027, and 564 bp fragments.
Then Gel Electrophoresis - Analyze samples of the restriction digests, along with a marker, by agarose gel electrophoresis.
Then-Visualizing the Bands - Using ethidium bromide and UV light exposure, visualize the DNA bands and take a photograph. (Note: ethidium bromide was incorporated into your agarose gel in lab.).
|
Then- Determining the Lengths of the DNA Fragments - Determine the DNA fragment sizes. If necessary, construct a calibration curve for the marker data, measure the migration distances for bands in the experimental lanes, and use the calibration curve to determine the DNA fragment sizes. Enter the results in a Table: |
|
|||||||||||||||||||||||||||||||||||||
RE digest mapping; mol biol; http://www.nslc.wustl.edu

RFLP- ;https://www.ncbi.nlm.nih.gov

The SNPS or INDELs can create or abolish restriction endonuclease (RE) recognition sites, thus affecting quantities and length of DNA fragments resulting from RE digestion. https://www.ncbi.nlm.nih.gov
Take a piece of DNA from the clone, let us say it is 10kbp long or more, label the 5’ends with radioactive 32P. Then you cut one end to remove the radioactive tag. Clean the DNA free of the small 32P piece.
Assume the length of the DNA taken is 10KBp long and cut with E.coli I. Similarly use another piece of the DNA cut it with Bam HI, Another with Pst I. The separate the fragments of each of the enzyme cut fragment on different slots. Note in each of the cuttings only the fragment with label will show up in gel that is dried and auto radio graphed. The other piece though found in the same slot does not show up as radioactive fragment.
For example the DNA contains the label at one end. When you cut with E.coli I, it will cut at many site, wherever the sequence is found, but among these only one contains the tag. Remember the digestion by the enzymes is only partial and should not be complete. Partial means one enzyme cuts one of the several fragments at one site not more. For this one has to adjust the concentration of the substrate and the enzymes.
*I--1--2--3--4--5--6--7--8--9--I
Here the length is denoted by the number of nucleotide; 1=1000.2=2000 and so on. The astrich shows the position of the label. Let us say E.coli! has cut at position 2, 4 and 8. When you run the fragment on an Agarose gel and look for the radioactivity only 3 bands appear i.e. one with 0-2, 0-4 and 0-8, so three fragments are visible and we know where the sites for E.coR1 are present. Similarly cut with Bam H I, let us say it has sites at 3, 5 and 9; you get 3 fragments. Use another enzyme Pst I and let us say it cuts at 1, 6 and 7; this produces 3 fragments.
If such fragments cut by each enzymes are run on different slots, one can read the RE site of each and the size of each fragment and the sequence of each site. One has to use the marker for the size of the size of the fragment.
|
Marker |
E.coR I |
Bam H I |
Pst I |
|
-------1 |
|
|
==== |
|
-------2 |
==== |
|
|
|
-------3 |
|
==== |
|
|
-------4 |
==== |
|
|
|
-------5 |
|
==== |
|
|
-------6 |
|
|
==== |
|
-------7 |
|
|
==== |
|
-------8 |
===== |
|
|
|
-------9 |
|
==== |
|
|
-------10 |
|
|
|
Now read the fragments and their site from the bottom. The bottom most fragment is 9, it is Bam H 1, the next fragment is at 8 , it is E.coR I, the next is at7 and is at Pst1. If you go on reading you get the sequence of RE sites like
I----Pst I-EcoR I-BamH-RI-BamH1-Pst1-Pst1-R 1-BamH1---I.
Thus one knows where the site for each of the REs. This greatly help in cloning, sequencing, aligning each fragment in sequencing, create mutations by deleting and filling up the cut ends
Gel electrophoresis is used for RE mapping:
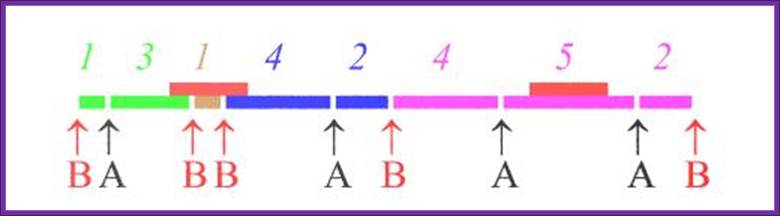
RE A
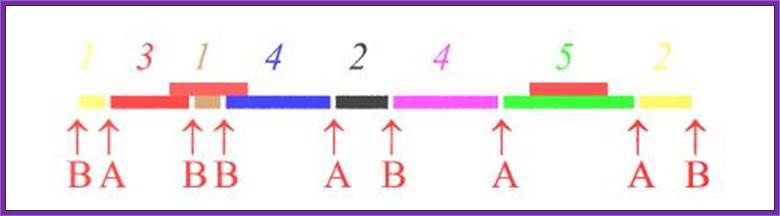
RE B
RE A and B