Gene Structure.
Introduction:
‘Genetics of the Genes’:
Hippocrates a Greek physician, 400BC described that reproductive material comes from all parts of the body. Aristotle 350BC said that reproductive material is made up of nutrients- diverted to reproductive path.
Rudolf Jacob Camerarius 1694, pollination is responsible for inheritance, so pollen considered as male and pistil female. Joseph Gottlieb Kolreuter crossed between different tobacco plants (during 1761- 1766) showed resemblance of one or the other parent. (Note-childern show faces either of the parents or blended forms).
In 1824-Goss obtained results similar to Thomas Andrew Knight; used by emasculating and fertilizing from other source; emasculated green pod producing plant flowers and pollinated from yellow pod plants, and got yellow plant like male parent first generation, followed by selfing in second generation and found green and yellow, followed by self-pollination–leading some all yellow and some all green pods. Such experiments were done in 18th and 19th century for improving and developing new varieties, even today it is done.
In (1809) a French naturalist, Jean-Baptiste Lamarck propounded ‘inheritance of acquired characters’ now it is well known as Lamarckism (1744–1829), .
Charles Darwin 1859 proposed Origin of Species–described how characters are inherited as Pangenes- heritable particles from all parts of the body (1868) and collected in reproductive particles.
Between 1856 and 1865, Augustinian Friar Gregor Johann Mendel cultivated and tested some ~29,000 pea plants. He kept the record of the pattern of characters expressed. In 1865 he read his work and published in 1866 Natural History Society of Bmo Feb 8th 1865. Mendel sent his paper to Darwin for his comments and his advice. He was little disappointed for not getting good response, yet he published his work in the Proceedings of the Brünn Society for Natural History. A bishop’s concept inheritance was contrary to their God’s Bible, which considered universe, stars, planets, plants and animals were created by God from nothing; Hey, Big Bang also produced this universe; the universe is still expanding at speed more than the speed of light. Mendel Died in 1884. Fortunately he did not call the factors as ‘Gods Particles’.
Francis Galton, a cousin of Charles Darwin. Starting with an article on 'Hereditary Talent and Character published his work the same year as Mendel's paper (1865), he spent many years investigating family resemblances.
Alfred Russel Wallace 1870-1876, had been advocating that species evolved and that the pressure or driving force of this evolution was natural selection or the fitness of the individual for the environment. Darwin inferred speciation without being able to observe it, given the geological time necessary for such changes to become fixed in a population.
It was not until 1902 when three experimenters, working independently, rediscovered the principles formulated by Mendel. Each of them, Hugo de Vries (1848-1935), Carl Erich Correns 1864-1933) and Erich Von Tschermak (1871-1962, cited Mendel's 1866 paper. However, as soon as the work was rediscovered, it created controversy (e.g., Weldon 1902).
Between 1884 (the year Mendel died 1884) and 1888; details of Meiosis was explained by Oscar Hertwig 1876, again in 1883 by Belgian zoologist Edouard Van Beneden (1846-1910). The significance of meiosis for reproduction and inheritance, however, was described only in 1890 by German biologist August Weismann (1834-1914); In 1911 the American geneticist Thomas Hunt Morgan (1866-1945) observed cross-over in meiosis in Drosophila melanogaster and provided the first true genetic interpretation of meiosis. Mitosis was explained by Walther Flemming 1882, his discovery of mitosis and chromosomes is considered one of the 100 most important scientific discoveries of all times and one of the 10 most important discoveries in Cell Biology, they reported, the cell nucleus was identified as the location of the genetic material, and "qualities" were even proposed to be transmitted via chromosomes to daughter cells at mitosis. Thus chromosomes were considered as physical basis of heredity.
Finding the Genes:
 Hugo de Vries in
1889, who, at that time probably unaware of Mendel's work, in his book
Intracellular Pangenesis, coined the term "pangen" for
"the smallest particle [representing] one
hereditary characteristic". The proposed word Gene
traced from the Greek word genos, meaning "birth".
Hugo de Vries in
1889, who, at that time probably unaware of Mendel's work, in his book
Intracellular Pangenesis, coined the term "pangen" for
"the smallest particle [representing] one
hereditary characteristic". The proposed word Gene
traced from the Greek word genos, meaning "birth".
Wilhelm Ludvig Johannsen (1909) abbreviated
this term to "gene" coined
the word "gene" ("gen" in Danish and German, means word
"gene" means ‘Good Sense”) to describe the fundamental physical and
functional units of heredity. The term ‘genetics’
was coined by- Bateson (1906) a firm supporter of Mendel. The terms ‘genotype’
and ‘phenotype’ were coined by- Johanssen
The term "chromosome" was first suggested in 1888 by the German anatomist Heinrich Wilhelm Gottfried von Waldeyer-Hartz (1836–1921). Waldeyer-Hartz used the term to describe certain structures that form during the process of cell division (reproduction)". Through the works of scientists such as Thomas Hunt Morgan (Nobel prize in 1933) and his student Alfred Sturtevant, the theory of how genes are inherited took firm shape in due course of time. The location of many Mendel’s factors (now called genes) was determined by Thomas Hunt Morgan and his coworkers in the early 1900's. Astonishingly prolific insect and possessing only four pairs of chromosomes, Drosophila melanogaster (aka the fruit fly) has been the workhorse of geneticists for almost a hundred years. Beginning early last century, Thomas Hunt Morgan and his students at Columbia University conducted breeding of fruit flies by the hundreds of thousands. At that time, the terminology of what we now call genetics was not even in place.
In 1910 Thomas Hunt Morgan (Columbia University) showed that Mendel’s factors (genes) are located on chromosomes, exchanged by crossing over. In 1911, Alfred Sturtevant, then an undergraduate researcher in the laboratory of Thomas Hunt Morgan mapped the locations of the fruit fly genes whose mutations the Morgan laboratory was tracking over generations. This was the first genetic map ever made.
In 1903 Walter Sutton and Theodore Boveri (German) formally proposed that chromosomes contain the genes. The Chromosome Theory of Inheritance is one of the foundations of genetics and explains the physical reality of Mendel's principles of inheritance.
Botanist William Bateson, firm supporter of Mendel coined the terms "Genetics" and "Allele" alternate forms of the factors in 1906, and three years later German biologist Wilhelm Johannsen coined the term "Gene" for Mendels’ factors 1909.
Theoretical resolution to the conflict was achieved by the geneticist Ronald Fisher in 1918 who demonstrated that the characters favored by the biometricians could be described in Mendelian terms if they were governed by the simultaneous action of many genes. Biometrical genetics refers to a set of mathematical models used to describe the inheritance of quantitative traits. A quantitative trait is a characteristic of an organism that can be measured, giving rise to a numerical value. Thus, Ronald Fisher 1918 demonstrated that characters are governed by a large number of independent Mendelian characters (polygenic characters) would display the quantitative variation and family correlations described by the biometricians. They can be:
Continuous: e.g. arterial blood pressure, stature.
Meristic: a count e.g. moles (nevi), bristles, digits, worm burden.
Ordinal: a ranking e.g. Fitzgerald tanning index, Norwood baldness score.
Categorical: e.g. eye color, type of cancer.
A parallel debate developed in evolution. Mendelian particulate genetics was seemingly at odds with gradual change that was implicit in Darwinian Theory. X-ray studies by Muller suggested that mutations would appear as sudden genetic 'jumps' rather than in a smooth, gradual manner. The two sides achieved a consensus about 1930 and summarized. Today one finds that both opinions are true. Even Lamarck’s view has been exemplified by experiments. In the 1920s, Harvard University researcher William McDougall studied the abilities of rats to correctly solve ‘mazes’. His reports claimed that offspring of rats that had learned the maze were able to run it faster. In his data, the first rats would get it wrong 165 times before being able to run it perfectly each time, but after a few generations, it was down to 20. McDougall attributed this to some sort of Lamarckian evolutionary process. Today Lamarckian acquired (Genetically Acquired)” characters are inherited. However McDougall's results have never been replicated by other experimenters, and have been criticized for having several methodological problems and poor record-keeping. Recently, researchers have reexamined this concept in light of discoveries in epigenetics and trans- generational epigenetics. In some cases, experiences of parents or even grandparents have been found to cause differences in gene expressions? Transgenerational epigenetic, non-Mendelian inheritance, effects include both the physiological and behavioral (intellectual) transfer of information across generations. Today medical research shows blood infusion of very young persons to older persons can invigorate old people as young people, at least in their brain at least this happens in mice.
During the rule of Joseph Stalin (a dictator) in the USSR in the 1930s; Do we have such dictators in Russia , North Korea, Italy had such history, Mussoloni; and Germany the birth place of Hitler? The theory of inheritance of acquired characteristics was central to the dogma put forth by Trofim Lysenko, president of the Soviet Academy of Agricultural Sciences. Lysenkoism was advanced primarily in service to Soviet agriculture, always resulting in dismal failure.
In 1869, the chemist Johann Friedrich Miescher (Mendel’s Time) discovered a material from the cell nucleus and called it as Nuclein. Later the Nuclein, the white powder turned out to be an acid so they called it as ‘Nucleic Acid’. This was the beginning of Biochemical-Molecular Biology. Further studies chromosomal staining studies by Robert Feulgen (1999) showed that the nucleic acids are made up of Feulgen negative and Feulgen positive substances (chromosome staining chemicals). First treat with acid, then with Schiff reagent and then with aceto orcien or aceto carmine. The positive to aceto orcien was called Deoxyribose Nucleic Acid (DNA) and Feulgen negative nucleic acid was called Ribose nucleic Acid (RNA) which can be stained with Orcinol. Feulgen regent was and is used to stain chromosomes. As chromosomes were considered as physical basis of heredity, the DNA characterization has become important.
Frederick Griffith 1928 (J. P. Morgan’s Time) used Streptococcus pneumoniae strain for bacterial transformation experiment. He used strains such as Rough II-R (nonpathogenic) and Smooth S (Pathogenic) strains. In this experiment, bacteria from the III-S strain were killed by heat (heat killed), and their remains were added to II-R strain bacteria. The combination was able to kill its host. This is a par excellent experiment on bacterial transformation rough to smooth strain.
Erwin Chargaff in the late 1940's analyzed DNA base ratios. The ratios obtained from different species were self- glaring, and Chargaff did not understand importance of it for he was preoccupied? He warned that the technology of genetic engineering poses a greater threat to the world than the advent of nuclear technology. Heat killed bacterial genetic material has transformed the native rough strain into disease causing strain. There are many such discoveries unheralded at their time, became the milestones for others work on them and got accolades.
The work of Oswald Avery and his collaborators Colin McLeod and Maclyn MacCarty in 1944 at Rockefeller University led to their publication, of evidence that a DNA component of certain bacterial strain Streptococcus was capable of transformation. They used in vitro bacterial transformation and opined that DNA as the material responsible for the genetic transformation. Thus DNA as the physical basis of inheritance was established.
Barbara MacClintock 1944 showed the action of transposable elements (often called jumping genes) but the Nobel Prize was given in 1983 at the ages of 83. She produced the first genetic map for maize, linking regions of the chromosome with physical traits, and demonstrated the role of the Telomere and Centromere, regions of the chromosome that are important in the conservation of genetic information. She was recognized amongst the best in the field Genetics, awarded prestigious fellowships, and elected a member of the National Academy of Sciences in 1944. Her discovery was a great milestone in the field of Genetics especially plant genetics, later the presence such elements in human genome was discovered and they are very common among most of the eukaryotic genomes without any exception.
Erwin Schrödinger published, in 1944, a small book called ‘What is Life’? One young physicist who responded to this challenge was Max Delbrück (bacteriophage Lambda) -1932-39. He along with Salvador Luria 1942 and Gunther Stent 1924-2048, acted as driving force behind the development of the new science of ‘Molecular Genetics’.
Alfred Hershey and Martha Chase (1952), used differentially labeled T2 bacteriophages and showed that the DNA as the genetic material, supporting the bacterial transformation principle, so it is confirmed that DNA as the genetic material (Gods’ DNA). Today the term DNA is used colloquially to say it is in her DNA or in his DNA for their actions and behavior.
In 1892, (long before Griffith’ experiments) TMV was discovered by Dmitri Ivanovsky, later people showed that TMV contained RNA; as it showed all the features of DNA , it was considered as genetic material and called ‘Genetic RNA’ for it was capable replication, capable mutation, capable of recombination and code for proteins. This kind of RNA is distinctly different from eukaryotic cellular RNAs. Tobacco mosaic virus was the first virus to be crystallized. It was achieved by crystallographer Wendell Meredith Stanley in 1935 (Nobel laureate) also showed that TMV remains active and alive even after crystallization. Can it be possible to freeze humans with proper treatment and rejuvenate it back to life after hundred years? For his work, he was awarded 1/4 of the Nobel Prize in Chemistry in 1946. Rosalind Franklin worked for Stanley to elucidate TMV structure using crystallography. TMVs were capable of replication, they can undergo mutation (very frequently), and they can undergo recombination (rarely) and perform function in the form of producing polypeptides. Only some viruses contain RNA as the genetic material either in (+) or (-) form and inherit the hereditary material.
Enter the Double Helix:
In the 1950s, at the
Cavendish Laboratories in Cambridge, England, scientists developed X-ray
crystallography, a technology that made it possible to interpret the
three-dimensional structure of a crystallized molecule. It allowed Maurice Wilkins and Rosalind
Franklin (died in 1950 of cancer at the age 27) to take
"snapshots" at DNA. Rosalind Franklins X-ray diffraction photographs
were used by James Watson and Francis Crick to build their now-famous model: they developed
a module that DNA was shaped like a ‘spiral staircase’, or double helix.
And it was from the related efforts generated by this demonstration that the X-ray crystallographic work of Rosalind Franklin and Maurice Wilkins and proactive James Watson, lead to the DNA’s structural model proposed by James Watson and Francis Crick in 1953 (Nature). This heralded the beginning of ‘Quint Essential Molecular Biology’.

One of Watson and Crick's original models for the structure of DNA, displayed in AMNH's exhibit "The Genomic Revolution." Roderick Mickens ©AMNH
In 1957 Francis Crick and George Gamov worked out the "Central Dogma", means DNA to RNA and RNA to protein. In 1962 Crick, Watson, and Wilkins shared the Nobel Prize in medicine and physiology, Miss Franklin has died in 1958 fate made her to miss it.
Gene, a concept, as a unit of heredity factor, developed in middle of 19th century by a monk, (“believe it or not he did not say ‘Gods’ Particle’) when there was big controversy and confrontation was fermenting between prudent scientists like Charles Darwin and his supporter Aldus Huxley on one side and church on the other side. Even at the beginning of twenty first century skirmishes between the “Gods-men” and the enlightened public phoo-phooed Gods-Men, the question GOD still a concept. The astonishing but demoralizing aspect of religion, customs and god’s men, especially the prophets and perpetrators of religion as a cult, is using the name of religion and their “God” to undermine science. People of one religion, in the name of God, terrorizing or abusing the other communities and religions belonging to another God, are atrocious; this is happening even in countries that are advanced in science and technology. How many gods we have on this planet earth? It is a shame on any society, that accepts the dictates of a religion, which enforces that origin of life, and evolution should not be taught in schools and should not be believed. In 21st century, new avatars of religion are ‘Creationists’, who claim that creationists’ concept is scientific and GOD is a ‘Supreme Creationist’. He was born out of Big-Bang that created our present Universe. We don’t know how many universes exist today, for our scientist cannot observe beyond our borders of our universe. This supreme creationist, a super scientist par excellent, created the whole universe in seven glorious days and on seventh day he created a male ‘ADAM’, and then created ‘Eve” by joining strings of genes as chromosomes, male was differentiated from the female by creating a Y chromosome for males and X chromosomes for females.
· Defining a gene looks simple and but not simple, and it is complicated as well. It is a unit of heredity, that can duplicate, mutate, recombine and perform a function; the effect can be biochemically metabolic, structural, phenotypic and all. The Gene is the physical basis of heredity and made up of genetic material, paradoxically not all the genetic material contains genes. The genetic material consists of functional part a small amount and a large amount of nonfunctional material.
At molecular level, it is explained, rather than defined that it is a discrete segment of DNA that is capable of undergoing replication, mutation, and recombination and capable informing to perform a function in the form of RNA(s) translated into proteins, which execute functions. That is only part of the DNA that is functional but the genetic material is also made up of a large fraction as nonfunctional.
· Biochemists of 1950 and 1970s conceptualized that the gene as a segment of DNA capable producing one enzyme; one gene-one enzyme concept was propounded, the concept still holds good for those genes that produce a functional single polypeptide chain. One gene-one polypeptide concept has been further reconciled, in many cases, that one gene to multiple polypeptide chains. There are genes that don’t produce proteins directly, but function and perform and aid in producing proteins and perform cellular processes, which are as essential as protein coding genes; they are considered as non-coding ncRNA genes.
This is further complicated by the discovery of overlapping genes. Complications and reconciliation is forced, because one species of mRNA in different tissues can generate different processed mRNAs with different coding information by alternative splicing or editing. Added to this mind boggling situation, now it is known that a single gene producing one mRNA and one mRNA producing more than one polypeptide, but one polypeptide chain can produce more than one polypeptide units either by proteolysis or by Exeins-Intein splicing. It is becoming more intriguing genetic phenomena. In addition, the genes, though, most prokaryote has one continuous coded information but most of the eukaryotic genes are spliced with coded segments interspersed with noncoding segments. In some extreme case the non-coding region of one gene can be coding region in another tissue. It is becoming more puzzling and intricate, but Mendel died peacefully.
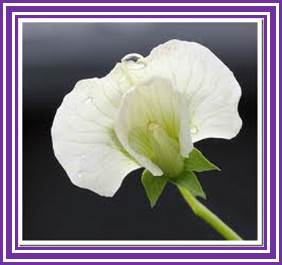
One has to realize that nuclear genes are different from cytoplasmic genes i.e. mitochondrial and plastid genes, each of them contain ~33 and ~150 genes respectively. These genes in most of the cases inherited maternally. These organelles have their own genomes and they function in semi-autonomous way, for their function often determined by nuclear genes. Particularly plastid inheritance can be phenotypically observed in plants like leaf variegation and other characters. Mitochondrial dysfunction can lead to many diseases.

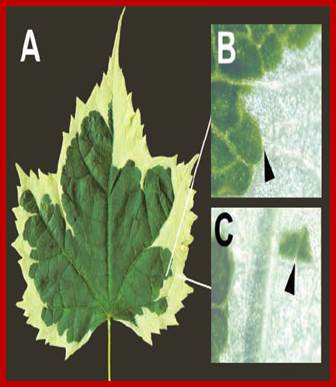
Variegated leaf, showing defective plastid as white spots; http://slideplayer.com;https://www.researchgate.net
Most importantly, ‘Gene’ concept and variability is the name of the game. Most molecular biologists have tacitly accepted that those genes which produce proteins are termed as structural genes, and those genes that produce tRNA, rRNA and other non-protein RNAs, but functional non coding RNA genes (Nc RNA genes), they are called by names based on their individual functions, like rRNA genes, sn RNA genes, tRNA genes, scRNA, sRNA, snoRNA, si/mi RNA, LincRNA, Xist RNA, activator RNA and others. But some authors however consider tRNA, rRNA and several other noncoding RNA genes as functional parts of structural genes.
· Whether they are protein producing or non-protein producing, each of the genes has specific positions in the genome and each has specific size and defined structure and functions.
It is an accepted fact that the size of the mRNA is proportional to the size of polypeptide chain (in general applicable to polypeptide producing genes). However, the size of the gene is not proportional to the size of proteins they produce.
· Interestingly the relationship between the gene, RNA and polypeptide chain is co-linear, where information between DNA and RNA is co-linear and the relationship between polynucleotide chains with that of polypeptide chains, a relationship superimposed by co linearity between the sequence of nucleotides and amino acids in specific orientation. It is an amazing colinearity.
This is all about Genomics, Proteomics and Bioinformatics, where Bioinformatics relates Genomics to RNomics and RNomics to Proteomics or vice versa (B to G and B to P); understanding of it is very important and ‘Enlightening’.
Kinds of Genes:
Pseudo and Cryptic Gene:
A large number of genes, especially in eukaryotes, have been rendered inactive or hidden from expression. The defective ones are called pseudo genes and those remained unexpressed are called Cryptic genes.
· Pseudo genes exist as family of genes ex. Some U-Sn RNA genes, some Globin genes, Alu-family genes and few others. It is difficult to estimate such genes quantitatively in a given genome. How long do they have existed? Do they create problems to other genes or helpful to others? Such questions are only for semantic purpose.
Defective copies of alpha and beta globulin genes are found in humans. Globin genes are found as alpha and beta cluster. Pseudo genes for both of them are found in each of these clusters. Alpha genes have mutation in initiator codons, and few of them exhibit frame-shift mutations, so they are not translatable but can be transcribed. Simple mutation in beta chain causes sickle cell anemia.
· In mouse there are two pseudo genes for alpha globins and one of them is called psi-alpha-3. This gene lacking introns and it is believed that it is a processed gene.
There are many possibilities, that a processed or spliced and modified mRNA can be converted to ds c-DNA and inserted into certain sites randomly anywhere in the genome.
· Many introns of both group II and I class are capable copying and inserting; similar to that of Transposons.
Sn RNA genes, especially of U related genes, thousands of them are known to exist as pseudo genes. Pseudo genes for U1, U2 and U3 have been identified, they are found scattered all over the genome in the form of clusters.
· Drosophila has few histone pseudo genes.
In human genome one finds several sequences which are called Alu family of genes, 300 000 or more in number, which are dispersed as repetitive segments all over the genome. Each of them is ~300 bp long and transcribed by RNAP-III. This is an example for pseudo genes to exist as repetitive class of genes.
· Most of the pseudo genes have 6 to 21 bp direct repeats at their flanking regions, indicating features of insertional elements. Perhaps they might have been derived from retroviruses or mRNAs or both.
It is good to differentiate between silent and cryptic genes. Cryptic genes are silent but not pseudo genes. Most of the time they are silent, but they can be activated by specific stimulants. Such genes are spread all over the genome. They are collectively called “selfish” DNA. Such DNAs make a copy of them and integrate at different locations and spread their number and they don’t confer any phenotypic advantage; example, in E.coli, beta Glycoside utilizing genes Bgl, Cel and Arb-T. They mutate spontaneously to a phenotype, which can be detectable; such genes are exclusive to E.coli.
· Genes for citrate utilization in E.coli is another example of cryptic genes. Most of the cryptic genes are in transient state between active and silent; oscillate between these states for they are directed by changing environmental conditions. In a selective but favorable environment such genes can be in Majority of them remain silent under unfavorable conditions, but at times they can be active even the conditions are unfavorable.
Processed Genes: There are many such genes remaining as ‘molecular fossil genes’. They are mRNAs coded for by a specific genes get reverse transcribed and inserted into their genomes but functionally inert. There are several thousands of such genes in eukaryotes.
Promiscuous Gene or DNA:
DNA belonging to a particular system, bacteria, mitochondria or plastids, if translocated to another system where it does not belong, such DNA is often called promiscuous DNA. Plastid as symbiont, its DNA (most of it) was translocated into the nucleus such DNA is called promiscuous DNA. In corn, an X-kbp long plastid DNA was found translocated into mitochondrial DNA. There are cases where several chloroplasts DNA are transferred into mitochondria. This is detected by their homology. Such transfers are found in yeasts. Most of the original symbiont mitochondrial and cyanobacterial DNA was transferred into the Nucleus that is the reason mitochondria and plastids require nuclear coded gene products for their survival and function. Such illegitimate and promiscuous transfers are found in Mung beans, Spinach, Corn and Peas.
Such promiscuous transfers from one system to another have taken place since organisms existed side by side over a long long time. Promiscuity is way of life and the spice of life. During the elapsed time, if the theory is correct, much of the symbiotic bacterial DNA has moved into the nucleus, but its genome has retained only few genes and yet functions as if they are different from one another, because they are interdependent with each other.
Genes in Alternative and Multiple forms:
Most of the genes exist in di-allelic state, where one is completely dominant over the other or co dominant. There are many genes exist in multiple form and exist independent each other and codominant. A good example for multiple alleles is ABO blood group genes.
Alternative forms- Dominance/Recessive genes:
Mendels ‘Factors’ inheritance has a pattern, which shows factors exist in two alternative forms such as Dominant and Recessive. He did not know that heritable factors exist as alleles located on homologous chromosomes in diploid organisms. Mendel’s’ heritable factors are now called Genes. Genes express proteins and RNAs of different kinds. Proteins are functional molecules which act as enzymes or structural or regulatory molecules. Mendels’ phenotype is controlled by specific biochemical pathway executed by specific proteins or combination of proteins.
In the case of alternative forms of diallelic genes, one expresses full phenotype and the other does not show its phenotype; the former is called Dominant and the latter is called Recessive, when both gene exist in the cells. But there are other forms, where the dominant gene is not sufficient to produce the full phenotype and the phenotype is in between the dominant and recessive, called Intermediate’ inheritance.
Alleles: A gene existing in two different forms, such pair of genes are called alleles. Most of the Mendelian alternate phenotype factors are alleles. Now it is known a single mutation in one of the alleles can create another allele. The locus G6PD has an astonishing 320 alleles, all in one gene. Note: G6PD is an enzyme deficiency that affects 10% of the world's population in areas where malaria is common. The gene for Phenylketonuria has 60 alleles. These alleles need not be functional.
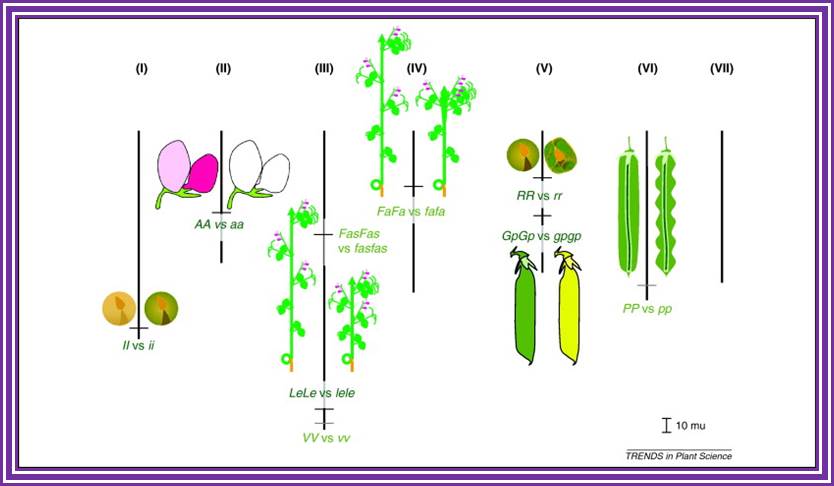
Mendels’
seven pairs of factors and their phenotypes;
https://www.slideshare.net
Mendels’ Pisum sativum phenotype and Biochemical explanation:
|
Trait |
Dom |
Recw |
symbol |
linkage |
cloned |
function |
Mol. Nature of mutation |
|
Shape |
Round |
wrinkled |
R |
V |
Y |
Starch branching enzyme 1 |
0.8 , transposons’ insertion |
|
Length |
Tall |
Dwarf |
Le |
III |
Y |
GA3 oxidase |
G to A substitution |
|
Cotyledon color |
Yellow |
Green |
I (I / i) |
I |
Y |
Stay green gene |
6bp insertion |
|
Flower color |
Purple |
White |
A |
II |
y |
bHLH TF |
G to A at splice site |
|
Pod color |
Green |
Yellow |
G/r |
V |
No |
Plastid in pod wall |
Un |
|
Pod form |
Inflated |
Constricted |
V? |
III |
No |
Sclerenchyma in pod |
Un |
|
Position of flower |
Axial |
terminal |
FA |
IV |
no |
Meristem function |
un |
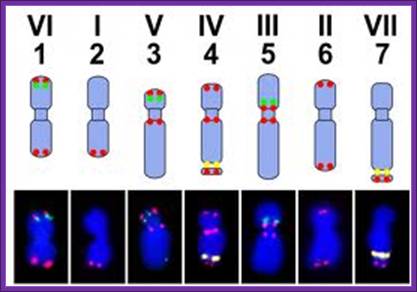
The upper panel shows a scheme of the pea karyotype with the loci for PisTR-B (red), 5S rDNA (green), and 45S rDNA (yellow). The bottom panel shows the same loci detected by FISH on isolated metaphase chromosomes. Bar = 5 µm; Peas in Genomic Era; Petr Smýkal 1,2, Gregoire Aubert 3, Judith Burstin 3,
MENDEL’S GENES;
|
Trait |
Gene |
Chromosome |
Notes |
|
Seed shape |
R |
7 |
Smooth dominant to wrinkled |
|
Cotyledon color |
I |
1 |
Yellow dominant to green |
|
Flower color |
A |
1 |
Opaque dominant to colorless |
|
Pod shape |
v/p |
4/6 |
Inflated dominant to constricted |
|
Pod color |
gp |
5 |
Green dominant to green |
|
Flower position
|
fa |
4 |
Axillary to apical |
|
Stem length
|
le |
4 |
Long to short |
Source: Fairbanks and Rytting.-Goings on in Mendel’s Garden; by Kenneth Weiss.
Haploid genome size as big as 4.45 Gbp (4.5 X 10^9bp) is known; it is now known that about 50–60% of pea nuclear DNA is made up of moderately to highly repetitive sequences; studies of sequence composition of the pea genome employing DNA reassociation kinetics and melting behavior measurements indicated that 75–97% of the genome is made up of heterogeneous populations of repetitive sequences. Pea has a high number of diverse satellite repeats; some of the satellites provide useful cytogenetic markers allowing discrimination of individual chromosomes within the karyotype.
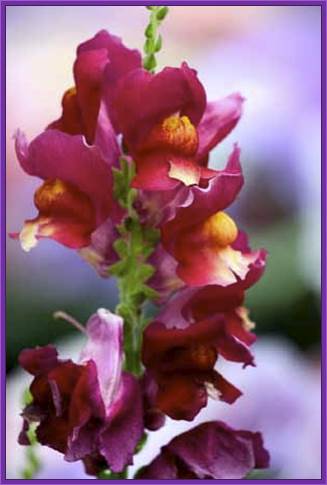
Incomplete Dominance:
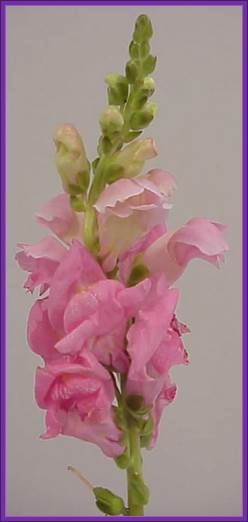
In Mirabilis jalapa and Snap dragon when pure Red flowered plants are crossed with pure White flowered plants, the first generations of plants produce in- between color that is Pink. This is due to expression of one of the red gene allele in heterozygotic condition. The expression of a single gene is not sufficient in comparison with Pisum sativum flower color where a single gene produces full color pigments.

http://www.whatabloom.com(Reddish),www.samson.kean.edu (white); https://www.pinterest.com(hybrid)
This phenomenon is called Haplo-sufficiency (one gene is enough) and the Pink color flower situation is called Haplo-insufficiency for the product of the single gene is not enough to produce the full color. On the contrary some cases only one gene can generate full phenotype- is called Haplosufficiency.
Haploinsufficiency-incomplete dominance Mirabilis jalapa and Snap dragon:
P1: Red flowers X White flowers


Mirabilis jalapa; Often these plants produce yellow flowers but they change into Red color

F1: Pink flowers (all); www.origami-flower.org (pink)
F2: 1/4 Red Flowers, 1/2 Pink flowers, 1/4 White flowers
Color of pea flower, Height of the Pea plant, Shape of the seed is explained at gene functional level.
Flower color: Purple is dominant over white, Color of the flower is due to the expression color pigments, such as anthocyanins. Anthocyanins are the products of flavonoid 3’-5 hydroxylase which convert dihydrokemferol (DHIK) to dihydroquercetin (DHQ) and then to dihydromyricetin (DHM). Anthocyanins are glucoside of anthocyanidins. Mutation in this gene cannot produce color so the flower remains white. Previous investigations suggested that the white flower color is due to recessive allele caused by disruption of a regulatory gene. A single base mutation from G to A stops the pigment formation. The synthesis of color pigments is not a one step process, so it is the product of multiple step biochemical pathways. Perhaps the final or one of the middle gene products has been used for the study.

https://iweb.langara.bc.ca/
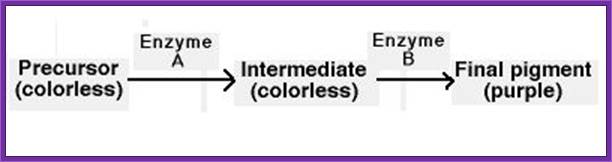
In some instances, several genes contribute to a phenotype as part of a biochemical pathway. Flower color in sweet peas is an example of this. The flower pigment, which is purple, is produced in two steps. According to this pathway, if either the gene encoding enzyme A or the gene encoding enzyme B is mutated such that no functional enzyme is produced, the flowers will not have any purple pigment, and the flowers will be white by default. Therefore, mutation of either of these genes gives the same phenotype - white flowers.
Now it is possible to change flavonoid biosynthesis and change the color of the flower by genetic engineering, thus they have changed the color of rose (blue Rose), petunia (brick red Petunia) and carnation-Dianthus (violet Carnation). This gene engineering has great prospects in horticulture.

Pea flower color-purple and White; in this case a single purple gene is enough to produce the color pigments fully; www.google co in

Hybridization between purple colored and white colored Pisum plants and their progeny in the first generation. www.beautysmile.ma
The gene the researchers found it encodes a transcription factor – a protein that switches the expression of genes on and off. This transcription factor switches on the ‘expression of genes’ involved in making anthocyanin pigments in pea flowers, making them purple. The gene is flavonoid-3',5'-hydroxylase (F3'5'H).
;)
Figure : Two-step production of anthocyanin.; Two genes are responsible for the chemical reaction that produces the plant pigment anthocyanin from a precursor molecule. Gene C controls the first step in the reaction to produce the step 1 product, and gene P controls the second step in the reaction to produce anthocyanin.© 2008 Nature Education All rights reserved.
Anthocyanin; The second major class of compounds found in red wines are anthocyanins. ; http://www.micro-ox.com
Round and wrinkled seeds: During seed maturation seeds are filled with starch for the enzymes involved are functional. The amylose is polyglucose held by alpha 1-4 linkage. The starch molecules can be branched by an enzyme called Starch Branching Enzyme 1 (SBE1), this ads oligo glucoses to unbranched amylose chain at intervals with formation of a1-6 linkages. The branched amylose is called amylopectin. Unbranched starch in fully developed seed absorbs water and become round, but on drying they lose water and becomes wrinkled. On the contrary the branched starch holds water and remains round. Round is dominant over wrinkled. A mutation in the SEB1 gene in the form of insertion of 800bp long transposon like elements (Ac/Ds family) into the genes is responsible for this phenotype. The amylose gene is 3550 bp long and 960a.a long Starch branching enzyme protein.

http://www.sweetgourmet.com
Height of the plant: Growth of the plant to its height is due to elongation of internodes. The gene for the height of the plant has been discovered, it is LE a dominant gene. This gene product is responsible for oxidation of Gibberellin GA20 to GA1. Mutation in the LE (GA3b Hydroxylase) “PsGA3ox1” causes nucleotide G to A substitution in the enzyme protein (bHLH) coding sequence at intron exon coding sequence Alanine to Threonine.
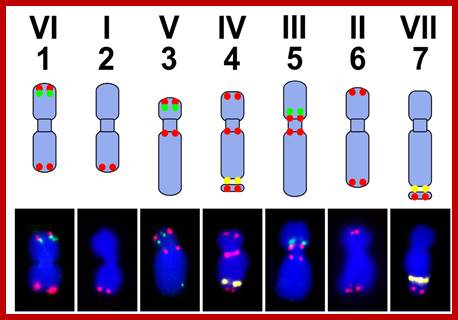
The pea karyotype. The upper panel shows a scheme of the pea karyotype with the loci for PisTR-B (red), 5S rDNA (green), and 45S rDNA (yellow) http://www.mdpi.com


A model of compound leaf development: KNOX proteins regulate a maturation schedule. Knotted1-like homeobox (KNOX) proteins, transcription FACTORS; , http://dev.biologists.org
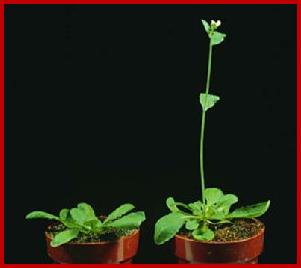
Tall and dwarf; http://biology.kenyon.edu

Punnet square showing a parental cross of a two plants, one with alleles TT and the other with alleles tt. All offspring (F1) are tT, possessing the recessive short gene, and expressing the dominant tall gene. http://www.visionlearning.com

Punnet square showing the F1 cross of two plants with alleles Tt. As Mendel observed, 3/4ths of the offspring possess at least one copy of the dominant tall gene, while 1/4th of the offspring possess two copies of the short gene. www.visionlearning.com/
|
|
|
Figure; Later steps in the GA pathway in pea shoots. Steps regulated by feedback, light, and/or auxin are indicated. GA1 is the bioactive GA; GA8 and GA29 are deactivation products. The le-1 mutation impairs the activation step, GA20 to GA1. (Click image to enlarge.; John J. Ross, |

Pod color: Yellow GP/gp; Green/yellow, due to the presence of chloroplasts stay in green form ; Two new anthocyanin pigments, delphinidin 3-sophoroside-5-glucoside, and delphinidin 3-sambubioside-5-glucoside have been isolated from purple pods and from flowers with the cr cr genotype.
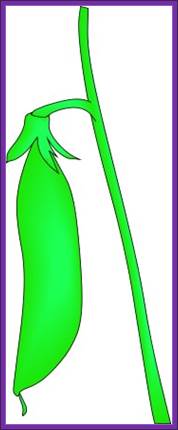
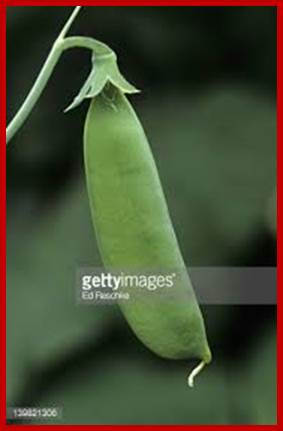
The genes for chlorophyll production are active in cells of the pod. The green pigment (chlorophyll) is produced in the pod. Genes for chlorophyll production remain active. http://www.gettyimages.com
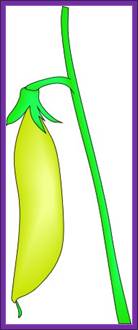

The genes for chlorophyll productions are not active in some pods, so chlorophyll is not produced. The yellow color results from yellow pigments that are produced independently of chlorophyll (and are present in green pods also). Chlorophyll production is a multiple step pathway. So the gene involved in the last step of the pathway can affect the color of the pod. Left left fig.http://www.indiana.edu;Right fig.https://www.brownenvelopeseeds.com
Pod shape: Round/Inflated and constricted; presence of sclerenchyma in the endocarp, lack of sclerenchyma p and v (endocarp) recessive mutants,
P/v and p/V. So synthesis of cellulose, hemicellulose, sclerenchyma and lignin and deposition determines the shape of the pods; Inflated pods contain thick walls and no strings.
Seed color: Yellow Peas I vs Green Peas i:
Yellow color of the seeds is dominant over Green color. Yellow peas (I) are dominant to green peas (i). The I gene is on chromosome 1. While pea seed i developing chlorophyll accumulate, but as it grows and enzyme called Pheide oxygenase (PAO) degrades chlorophyll. (Actually there are three enzymes involved in this degradation). Mendel’s gene for Y codes for this enzyme. When the gene for POA is mutated chlorophyll remains intact ‘stay green’ and green color is retained. In heterozygous condition one of the gene product is enough to degrade the chlorophyll, i.e Haplosufficiency; (Hortensteiner, 2006 and Armstead et al., 2007).

Yellow, The genes for chlorophyll degradation are active in cells of the seed. The previously-produced green pigment (chlorophyll) is broken down. The yellow color results from yellow pigments that are produced independently of chlorophyll (and are present in green seeds also). http://www.indiana.edu

Green; The genes for chlorophyll degradation are not active in the seed, so the previously-produced chlorophyll remains. http://www.indiana.edu
http://anthro.palomar.edu
Position of flower: Axial means all along the axis in the region of axillary regions, Terminal means false umbel at the end of the axis. Controlled by Fa and Fas genes. These are developmental genes they are not found as alleles, but many genes control the character.
Chromosomal abnormality; and the heritable diseases:
Each of the chromosomes contains thousands of genes, they have their specific position and structure and they are expressed. During cell division, especially during Meiosis homologous chromosomes segregate but independently producing haploid genome sets, which are used for fusing with opposite sex gametes. May a time chromosomal segregation is not equal, but unequal, thus cause chromosomal abnormality, this can lead to human malfunction and malformation.
Chromosomal abnormalities:
Examples include Down syndrome (extra chromosome 21), Turner Syndrome (45X0) and Klinefelter's syndrome (a male with 2 X chromosomes).
One example is the triplet expansion repeat mutations which can cause fragile X syndrome or Huntington's disease. Defective genes may also be inherited intact from the parents. In this case, the genetic disorder is known as a hereditary disease. This can often happen unexpectedly when two healthy carriers of a defective recessive gene reproduce.
� Trisomy 21 ( extra chromosome 21) : Down syndrome; incidence based upon maternal age, though translocation type is familial; features can include: epicanthal folds, simian crease, brachycephaly, cardiac defects.
� Trisomy 18 (47, XY,+18): Features include micrognathia, overlapping fingers, horseshoe kidney, rocker bottom feet, cardiac defects, diapragmatic hernia, omphalocele.
� Trisomy 13 ( Patau Syndrome also called D-Syndrome): Features include microcephaly, cleft lip and/or palate, polydactyly, cardiac defects, holoprosencephaly.
� Trisomy 16: Seen in abortuses from first trimester. Never liveborn.
� Monosomy X: Turner's syndrome (45,X 0); can survive to adulthood; features include short stature, cystic hygroma of neck (leading to webbing), infertility, coarctation.
� Klinefelter's syndrome (XXY, a male with 2 X chromosomes); features include elongated lower body, gynecomastia, testicular atrophy (incidence: 1/500 males)
� Triploidy: There is often a partial hydatidiform mole of placenta. Fetal features include 3-4 syndactyly, indented nasal bridge, small size.
� Idic 15 or isodicentric 15 :inverted duplication of chromosome 15 or tetrasomy 15
� Jacobsen syndrome also called the terminal 11q deletion disorder. This is a very rare disorder. Those affected have normal intelligence or mild mental retardation, with poor expressive language skills. Most have a bleeding disorder.
� XYY syndorm. XYY boys are usually taller than their siblings. Like XXY boys and XXX girls, they are somewhat more likely to have learning difficulties.
� Triple XXX syndrome. XXX girls tend to be tall and thin. They have a higher incidence of dyslexia.
A host of other chromosomal abnormalities are possible. In general, fetal loss earlier in gestation, and multiple fetal losses, more strongly suggests a possible chromosomal abnormality.
Gene mutations:
Genes can undergo induced or spontaneous mutation in the form of transposition of certain sequences, change in bases, deletion or insertion, duplication, inversion, all these change the genetic coding sequence and , so the sequence of amino acids; thus function of protein become abnormal. Thus one can find the said genes in the form of alleles, some are dominant and their counterparts are recessive, provided they don’t function.
A dominant allele is not necessarily more common in a population than the recessive allele.
For example, one baby in 400 is born with polydactyly, a condition in which individuals are born with extra fingers or toes. Polydactyly is due to a dominant allele. However, the recessive allele is far more prevalent than the dominant allele, 399 individuals out of 400 have five digits per appendage.
Single gene defects (some examples):
Phenylketonuria, (>60 alleles)
Alkaptonuria,
Hemophilia, DMD,
List of few dominant X-linked dominant-diseases
- Vitamin D resistant rickets: X-linked hypophosphatemia
- Rett syndrome
- Fragile X syndrome
- Most cases of Alport syndrome
- Incontinentia pigmenti
- Giuffrè–Tsukahara syndrome
- Charcot–Marie–Tooth disease
- X-linked hypophosphatemia
- Rett syndrome
- Sex linkage
- Aicardi syndrome,
- X-linked hypophosphatemic rickets.
- Y linked ; Examples are male infertility
Gene Interactions:
Every phenotype is the product of many genes and gene expression. Gene interaction can be due allelic gene interaction, and it can also be due to non-allelic gene interactions; it means two or more different genes located at different positions express their genes and the products produce the phenotype or biochemical product.
Allelic interactions between alleles of a single gene: The expression of the phenotype, the phenotype means, it can be physical appearance or it can be biochemical; it is due to complete dominance, incomplete dominance, codominance or and over dominance.
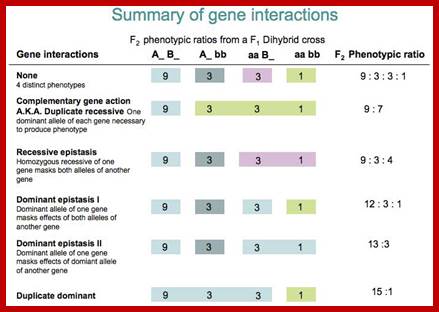
Such kinds of interactions modify the normal F2 ratio (9:3:3:1). Various types of such interactions are as below.
Gene Interaction F2 Ratio Test cross ratio
Complementary 9:7 1:3
Supplementary 8:3:4 1:1:2
Epistasis 12:3:1 2:1:1
Duplicate factors 15:1 3:1
Inhibitory factor 13:3 1:3
Polymerism: additive 9:6:1 1:2:1
|
|
|
|
|
|
|
|
|
|
|
|
|
|
|
|
|
|
|
|
|
|
|
|
|
|
|
|
|
|
|
|
|
|
|
|
|
|
|
|
|
|
|
|
|
|
|
|
|
|
|
|
|
|
- Complementary Gene (Ratio: 9:7): Sometimes a trait is produced by the interaction of two or more genes located on separate chromosomes, whose products interact and complement one another to produce a product. Lack of one dominant allele out of the two results in formation of a different character.
- Supplementary Gene (Ratio 9:3:4): Supplementary genes are two independent non allelic pairs which interact in such a way that one dominant gene produce its effect whether the other is present or not, but the second gene cannot do so unless the other is present.
Interactions among genes:
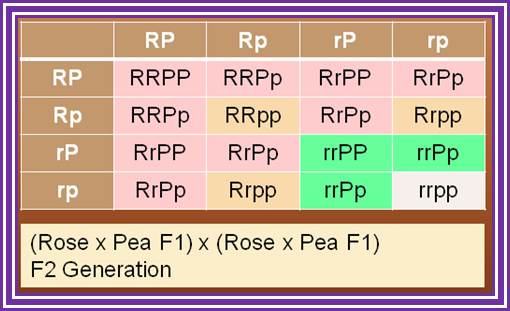
While one gene may make only one protein, the effects of such proteins usually interact (for example widow's peak may be masked by expression of the baldness gene). Novel phenotypes often result from the interactions of two genes, as in the case of the comb shape in chickens. The single comb is produced only by the rrpp genotype. Rose comb (b) results from R_pp. (can be either R or r). Pea comb (c) results from rrP_. Walnut comb, a novel phenotype, is produced when the genotype has at least one dominant of each gene (R_P_). Each of these genes effect or affect the comb characters such as shape and color.
Two loci, each with two alleles:
- Rose gene: R or r
- Pea gene: P or p
- Rose gene, if present in RR or Rr will produce a "rose type" comb-- but ONLY if Pea gene is present in pp condition.
- Pea gene, if present in PP or Pp will produce a "pea type" comb-- but ONLY if Rose gene is present in rr condition.
- If one dominant allele is present for BOTH pea and rose, a "walnut type" comb results. R_P_ will give "walnut" comb.
- If both alleles are present in double recessive condition, (rrpp), the wild type, single comb results.
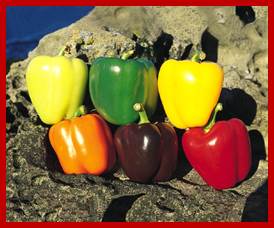
Y - timing of chlorophyll elimination (Y - early; y - normal); R - color of carotenoids (R - red; r - yellow); C - regulation of carotenoid deposition (C - normal; c1, c2 - lowered concentration); This leads to a few possible genotypes producing interesting phenotypes:
Y- rr c1c2 - pale yellow; Y- rr Cc2 - darker yellow; yy rr CC – green; Y- R- CC – red; yy Rr CC – purple; Y- Rr Cc2 - pale yellow; Three genes interact to produce different colors; http://www.bio.miami.edu
 http://www.bio.miami.edu
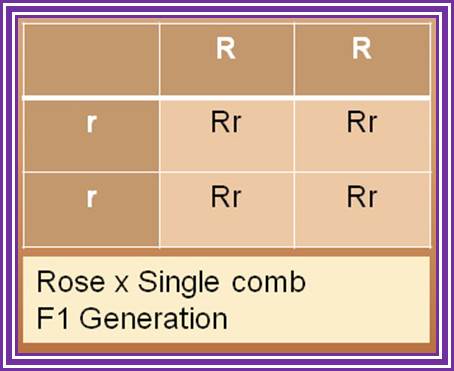

Gene combinations resulting from mating a chicken that breeds true for pea comb with one that breeds true for rose comb
Crossing the F1 offspring yields 9 Walnut, 3 Rose, 3 Pea, and 1 Single combed offspring in the F2; www.urbstonevalleyfarm.com
https://iweb.langara.bc.ca
Epistasis: Gene Interaction;
Epistasis, first defined by the English geneticist William Bateson in 1907, is the masking of the expression of a gene at one position in a chromosome, or locus, at one or more genes at other positions. Epistasis should not be confused with dominance, which refers to the interaction of genes at the same locus.
Epistasis and Hypostasis in Metabolic Pathways; Two different genes can also affect the same enzymatic pathway.
Epistasis has been described: an allele of an epistatic gene masks the full expression of alleles of a hypostatic gene at another locus. (If the allele of the epistatic gene happens to be recessive, we call the phenomenon recessive epistasis.). Epistasis indicates that genes often interact in some biochemical or developmental sequence, and that gene actions are not always simultaneous. For example, coat and skin color in Labrador Retrievers can be explained by the non-simultaneous action of two gene loci, B and E.

http://www.bio.miami.edu
The B locus controls the color of melanin pigment: B is black; b is brown
The E locus prevents melanin from being fully deposited in the hair shaft: E is full pigment; e is blocked pigment
The E locus is epistatic to the B locus: It prevents the complete deposition of the already-made melanin pigment in the hair shaft (though it does not affect deposition in the skin).
Thus, the epistatic locus operates "developmentally downstream" (i.e., after the B locus is already expressed) from its hypostatic gene.
Possible genotypes/phenotypes:
- B- E- will be black (fur and skin)
- B- ee will be yellow fur, dark skin
- bb E- will be brown fur, brown skin
- bb ee will be yellow with brown skin
The golden coat is an example of recessive epistasis: the recessive allele of a gene (i.e., the e allele that prevents pigment deposition) exerts epistasis over another locus (the B locus, controlling pigment color), resulting in the pale-colored hair shafts
What is Epistasis- Definition- by’ theagrocos’:
- Involves two pairs of non-allelic genes
- Both the dominant genes affect/effect the same character
- One of them, when present alone or along with other dominant gene expresses itself.
- The other gene expresses itself only when it is alone.
- The recessive forms of both the genes give rise to different phenotype
- The phenomenon of masking of effect of one dominant gene by the other gene is called as “epistasis”, and hence the interaction is named as epistasis. The masking gene is epistatic gene and the masked one is hypostatic gene.
- Epistasis is observed in fruit color of summer squash (white, yellow and green) and in many other traits.
White and yellow fruit colors are monogenic dominant over green color. When plant with white fruit is crossed with that with green fruit, progeny had white fruits.
But, in F2 segregation in the ratio of 12white: 3yellow: 1green was observed. This behavior is based on ratio of dihybrid cross, so the trait must be governed by two pairs of genes.
Suppose, gene W, gene Y and gene w produce white, yellow and green colors resp. Now, the genotype of pure white fruit plant must be WWYY as yellow fruited plants are produced in F2.
The gene for yellow color compulsorily should be present there. Both the recessive genes in homozygous condition produce green phenotype. So, genotype of pure breeding green plant must be wwyy. The F2 segregation shows that the effect of gene Y is masked by gene W, when both are present together.
Crosses Between ;
WWYYX white/green x wwyy white
= phenotype is white, in F1.
And
In F2 the phenotypes is 13 white: 3 Yellow : 1 green
A double mutant where one mutation masks the phenotype of another mutation: One gene masks the expression of the other gene in situation where two independent genes exist. Biochemically this is due to one gene product inhibits the action of another gene product, but the gene remains intact. This happens in a phenotype where the product is of multistep pathway.
Epistasis in short can be described as a mutant allele
masking the other. If mutant alleles exist for genes controlling two steps in
the same biochemical pathway, recessive homozygotes for one gene may mask the effect of another.
Interacting genes in same pathway with different mutant phenotypes may produce a
modified (9:3:3:1) ratio of 9:3:4.
Epistasis points to interaction of genes in some biochemical or developmental
sequence.
Molecular explanation for recessive epistasis in human blood groups:
Codominant blood group alleles
Educators flash cards; https://www.studyblue.com
Two parents who are apparently type O have offspring that is type A or B on rare occasions. • Bombay phenotype – mutant recessive allele at second gene (hh) masks phenotype of ABO alleles.
Different Glycoproteins distinguishes the characteristics of Blood Groups.
Two parents who are apparently type O have offspring that is type A or B on rare occasions. Bombay phenotype – mutant recessive allele at second gene (hh) masks phenotype of ABO alleles.
Lethal Alleles:
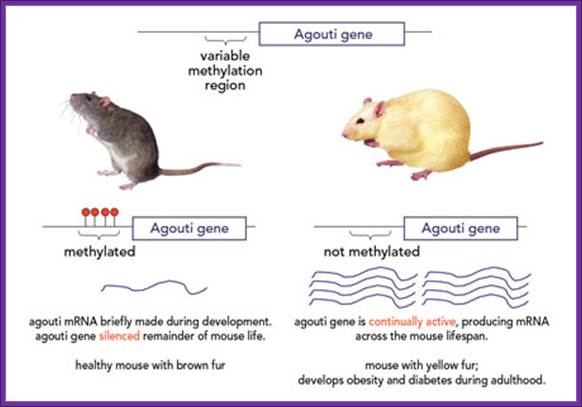
Yellow Gene in Mice
http://greatexperimentsblog.blogspot.com
An allelic gene where one of the expressed trait is lethal before it is observed.The difference stems from a tiny molecular tag made of carbon and hydrogen. In the healthy mice, this tag, called a methyl group, binds to the agouti gene, silencing it during the majority of development. No methyl groups are present at the agouti gene of the yellow mice and the gene remains active. The cells of living creatures contain millions of methyl tags, working as switchboard operators to control which genes are active and which are silenced.
The epigenetic patterns can be adjusted as cells grow and divide by altering the environment around the cells. If a female yellow mouse is fed a diet rich in methyl groups before and during her pregnancy, she will produce primarily brown-furred newborn mice with a silenced agouti gene (figure 2). The extra methyl groups protect the offspring from obesity and other adult-onset health problems. Surprisingly, this protection extends beyond the offspring and into the next generation of mice (the grandchildren of the initial yellow-furred mother). This finding suggests that epigenetic modifications can be passed across generations – a “memory” of environmental influence that occurred many years previously.
|
Genotype |
|
Phenotype |
|
YY |
Normal agouti |
|
|
Yy |
yellow |
|
|
yy |
lethal |
|
Yellow X Yellow
|
|
½ Y |
½ y |
|
1/2Y |
1/4YY |
1/4Yy |
|
1/2y |
1/4Yy |
1/4yy lethal |
Lethal Alleles (Mimi Educational);
Certain
alleles, when present in homozygous recessive condition, cause inviability or death
of the homozygous individuals. By definition, the gene that has mutated is
said to be an essential gene, since its "demise" causes death
of the organism that doesn't get its product.
Examples:
- dwarfing gene in rabbits
- yellow coat color in mice
- manx allele in cats
- Duchenne Muscular Dystrophy
- Tay Sachs disease
- cystic fibrosis
- Overo Lethal White Syndrome in horses.
Penetrance and Expressivity
Environment plays an important role in gene expression.
In the genes we have studied so far, a mutation is expressed:
- if dominant, in either the homozygous or heterozygous condition
- if recessive, if homozygous
This is not always the case.
Penetrance:
It is the proportion of individuals with a specific genotype who manifest that genotype at the phenotypic level. (Some individuals may not express a gene if modifiers, epistatic genes or suppressors are also present in the genome, which thwart expression.
Penetrance = 1.0 (100%) when all homozygous recessive individuals express the recessive form of the allele, and all homozygous dominant individuals and heterozygous individuals express the alternate form of the allele.
Penetrance < 1.0 if not all homozygous recessive individuals express the recessive allele.
Example: Brachydactyly in humans
Expressivity:
It is the degree to which a particular genotype is expressed in the phenotype of a particular individual. (That is, phenotype may be altered by heterogeneity of other genes which affect the expression of the particular locus in question, or by environmental influence.)
Neurofibromatosis in humans causes tumor like growths to appear all over the surface of the body if it is fully expressed. In mildly expressed cases, the person with this genotype may never have anything more severe than a few cafe au lai spots on the skin.
Piebald spotting in beagles (and some other mammals): dogs who have the same genotype for the piebald locus often express various patterns and total coverage of white fur patches.
Essentially, penetrance describes what happens in a population, and expressivity describes what happens in a particular individual.
Gene Family /Family of Genes:
Genes related one another by deviation from the common ancestor or in structure and functions. There are many examples, ex. Globin family, Histone family, Hox gene family and others. A list of genes given below (incomplete).
· 1 Regulatory protein gene families
- 2 Immune system proteins
- 3 Motor proteins
- 4 Signal transducing proteins
- 5 Transporters
- 6 Cyoskeletal proteins
- 7 Unclassfied families (wiki)
Internal Environment Can Affect Gene Expression:
Age-dependent Expression: As an organism passes through its life cycle, the expression of its genes changes. This means that some genes are not expressed until later in life. Examples:
- Huntington's disease (age usu. 30 or over)
- Male pattern baldness (age usu. 20 or over)
- Duchene Muscular Dystrophy (age 2-5)
- Grey coat color in horses (progressive lightening of the coat with age)
· Sex-Dependent Gene Expression
- In sex-influenced traits, expression varies depending on the sex of the individual carrying the alleles.
· e.g. - finger length (we already did this one)
· In other cases, autosomal genes cause the expression of a trait ONLY in one sex or the other.
·
Example:
Feathering morphology in chickens:
h+ - hen-feathering in male or female
(short, erect tail, short body plumage)
h - cock-feathering in male, if homozygous
(long tail, long body plumage)
- h+h+ - hen feathering in either female or male
- h+h - hen feathering in female; cock feathering in male
- hh - hen feathering in female; cock feathering in male
· Females express hen feathering, no matter what their genotype.
- Other examples of sex-limited traits:
- horns in some mammals
- lactation in female mammals
- ovaries in females; testes in males
- various secondary sex characteristics
Nature and Nurture:
The
genotype may set the limits for a particular organism's phenotypic potential.
The environment works on the plasticity of expression to produce different
phenotypes from similar genotypes. This is evident even in identical twins.
Norm of Reaction:
The degree to which phenotype varies with environmental influence.
We will return to this in more detail, in the Quantitative Genetics
portion of the course.
Variations in Mendelian Inheritance.
|
Gene interaction |
Inheritance pattern |
A-/B- |
A-/bb |
Aa/B- |
Aabb |
Ratio |
|
Additive |
Each genotype unique |
9 |
3 |
3 |
1 |
9:3:3:1 |
|
Complementary |
One from each dominantrequired for phenotype |
9 |
3 |
3 |
1 |
9:7 |
|
Recessive epistasis |
Homozygous recessive masks the second locus |
9 |
3 |
3 |
1 |
9:3:4 |
|
Dominant epistasis |
Dominant allele at one the second locusmasks |
9 |
3 |
3 |
1 |
12:3:1 |
|
Dupplicate epistasis |
One dominant either of the two is required for phenotype |
9 |
3 |
3 |
1 |
15:1 |
|
|
|
|
|
|
|
|
In Epistasis one of genes inhibits the expression of another gene; such genes can be dominant genes or recessive.
Codominance:
Many multiple alleles. A single gene existing in different forms exhibit different traits. Such multiple alleles are found in humans also. Human blood group, they are codominant to each other.
The ABO blood group determined by one set of blood group antigens by Multiple Alleles:.
There is a separate locus (H) that controls the production of these antigens. Individuals who are homozygous, hh, cannot produce antigens of the ABO type (and appear to be O-type).
Consider the following cross:
P0: AOHh ´ BOHh
What are the frequencies of the apparent blood groups among the offspring?
|
ABO locus |
Antigen |
Blood type |
|
|
|
1/4A |
3/4H 1/4hh no product |
A O |
|
|
|
1/4B |
3/4H 1/4hh no |
AB O |
|
|
|
1/4AB |
3/4H 1/4hh no |
AB O |
|
|
|
1/4O |
3/4H 1/4hh no |
O O |
|
|
Summary- 3/16A:3/16B:3/16AB:7/16O
Blood groups AB and O:
The ABO blood group system was discovered by Karl Land Steiner in 1901.Multiple alleles are a family of genes derived from the parent gene. RBC cells have no nucleus in humans but in birds they contain the nucleus. RBC contains surface membranes embedded with many surface proteins. Specific membrane anchored proteins are glycosylated; this is basis for blood groups. These genes and their products in whatever combinations exhibit co dominance.
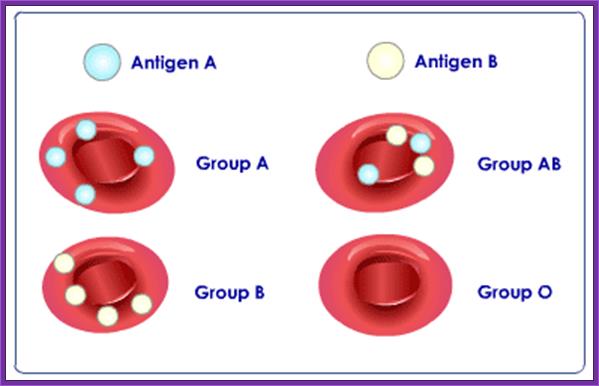
There are four basic Blood types:
- Type A with A antigens on the red cells and anti B antibodies in the plasma.
- Type B with B antigens on the red cells and anti A antibodies in the plasma.
- Type AB with both A and B antigens on the red cells and no blood type antibodies in the plasma.
- Type O with no antigens on the red cells and both anti A and anti B antibodies in the plasma.
- All the above types have sub variations.
Antegenic determinants on the surface of the RBC membranes.
https://coloursofhopefoundation.wordpress.com
in Laboratory Tests, Transfusion Medicine-The ABO antigens
(figure above): https://allaboutblood.com
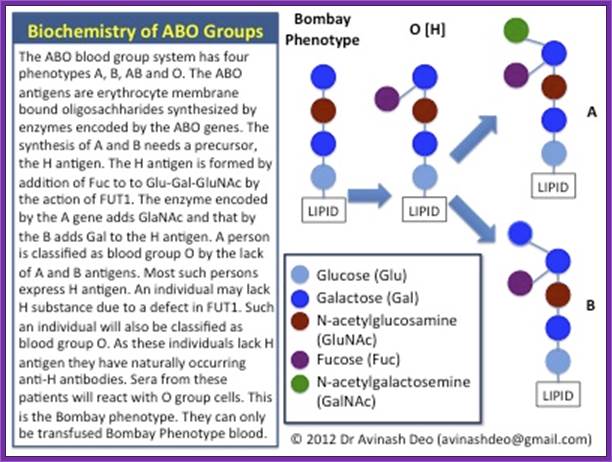
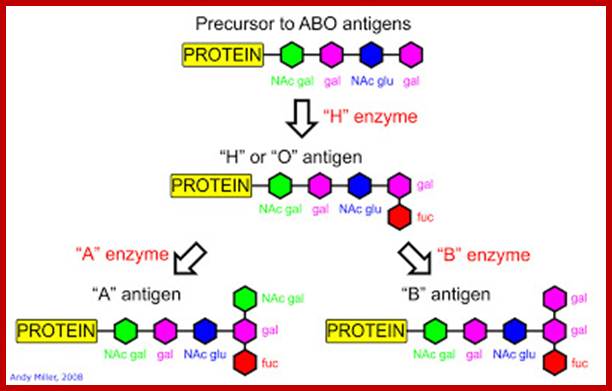
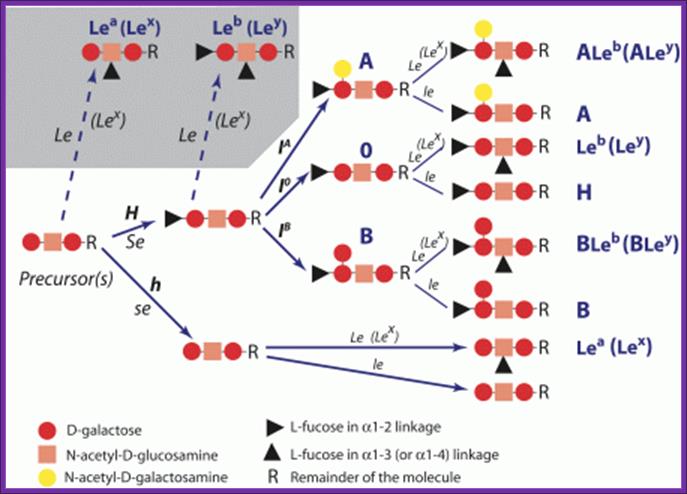
Antigens of the ABO system are polysaccharides. They are produced by the
interaction of genes at two loci, 19q13.2 and 9q34.1 in two steps. The first
step involves addition to a precursor of fucose in a α1-2 linkage to a
precursor by the action of FUT1 a fucosyltransferase synthesized by the gene
encoding for the H antigen located at 19q13.2. The second step is addition of
N-acetylgalactosamine or galactose by glycosyltransferases encoded by the genes
for A and B group antigens respectively. These genes are located at 9q34.1. The
phenotypes resulting from the action of the two genes are listed in table 1.
A and B are codominant and O is recessive. O group is encoded by a gene carrying a mutation resulting in a product that is neither capable of adding GalNAc nor Gal. The commonest O allele has a frame shift mutation resulting in the formation of a stop codon resulting in a premature termination of translation
![]()
About 200 alleles ABO genes have been described. Qualitative and quantitative differences between glycosyl-transferases encoded by these gene produces a red cell
Complementary Genes:
Polygenes (multiple factors):
Gene polymorphism:

http://nfs.unipv.it
- Quantitative Differences in ABH Genes: Quantitative differences exist in both A and B group antigens. A1, A2, A3, Ax, Am, Ael are subtypes of A with progressively decreasing A antigen sites. It has been estimates that A1, which is the commonest A subtype has 800,000 antigenic sites per erythrocyte, A2 has 250,000 sites and Am has only 800 sites. B1 is the most common type of B antigen. Weaker B antigens include B3, Bx, Bel. Individuals with a weak type of antigen can produce antibodies against a strong subtype of the same antigen. Patients with A2 can produce antibody against A.
- Qualitative Differences in ABH Genes:
- The Cis-AB Group: A rare and interesting type of blood group is cis–AB. usually individuals with AB have a gene for glycosyltransferases for A group on one chromosome and that for B on the other chromosome. They inherit one gene from each parent. Cases of AB children born to AB group mothers and O group fathers can only be explained if both the A glycosyltransferases and B glycosyltransferases activity is carried by the same gene. This is known as cis-AB. Apart from raising paternity disputes cis-AB can also complicate transfusion. The common types of cis-AB express a weak B (B3) and can have anti-B antibodies making only washed O or A cells suitable for transfusion to these patients (Br J Anaesthe 1999; 83:491-2).
- The Bombay Phenotype (figure 1 and 2): Blood grouping involves mixing patients cells with anti-A and anti-B sera. Group A cells agglutinate with anti-A, group B with anti-B and group AB with both. If no agglutination is seen the blood group is designated as O. The H antigen is a precursor to A and B antigens. Patients who have blood group O have inactive glycosyltransferases and nothing is added to H. H is the group O antigen. Rarely the gene for FUT1 mutated (h) resulting in an inactive product. These individuals do not synthesize H antigen and will not synthesize A or B antigens even if they have genes for the respective glycosyltransferases on chromosome 9q34.1. Their red cells will neither agglutinate with anti-A nor with anti-B sera and will be grouped blood group O. As they lack H they have agglutinating naturally occurring anti-H antibodies. When serum from these patients is mixed with cells from O group individuals the anti-H antibodies in their serum agglutinate O group cells. These individuals are group O on forward matching but not on cross-matching. This is known as the Bombay phenotype. Such individuals can only be transfused red cells from individuals of Bombay phenotype.
1. Rh Group of Genes: Neil D. Avent and Marion E. Reid
The Rh blood group system is one of the most polymorphic and immunogenic systems known in humans. The genes encoding 2 distinct Rh proteins that carry C or c together with either E or e antigens, or the D antigen, have been cloned, and the molecular bases of many of the antigens and of the phenotypes have been determined. The Rh blood group system is the most polymorphic of the human blood groups, consisting of at least 45 independent antigens.
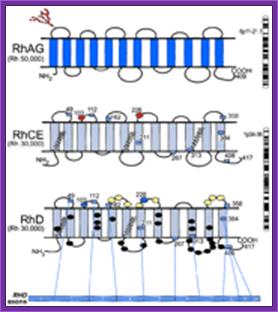
Model for RhAG,RhCE and RhD; http://www.bloodjournal.org
RhAG (Mr 50 000) consists of 409 amino
acids and is encoded by RHAG on chromosome 6p11-p21.1. RhCE and RhD (Mr
30 000) are predicted to have a similar topology and are encoded by RHCE
and RHD, which are adjacent on chromosome 1p34-p36. The domain of the
RhD protein encoded by each exon is depicted by numbered boxes, which represent
the start and finish of each exon. Of the D-specific amino acids, 8 are on the
exofacial surface (yellow ovals), and 24 are predicted to reside in the
transmembrane and cytoplasmic domains (black ovals). Red ovals represent amino
acids that are critical for C/c (Ser103Pro) and E/e (Pro226Ala) antigens;
purple ovals represent Ser103 and Ala226 on RhD. The zigzag lines represent the
Cys-Leu-Pro motifs that are probably involved in the palmitoylation sites. The
N-glycan on the first loop of RhAG is indicated by the branched structure of
red circles.
Red
and White Spots in the Flower:
Co-dominance,
where allelic products co-exist in the phenotype, is different from incomplete
or semi-dominance, where the quantitative interaction of allele products
produces an intermediate phenotype. For example in Co-dominance, a red
homozygous flower and a white homozygous flower will produce offspring that
have red and white spots.
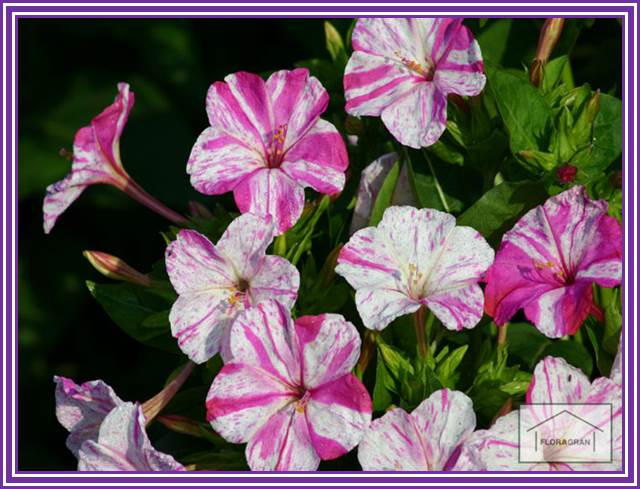
www.vanhemertseeds.com
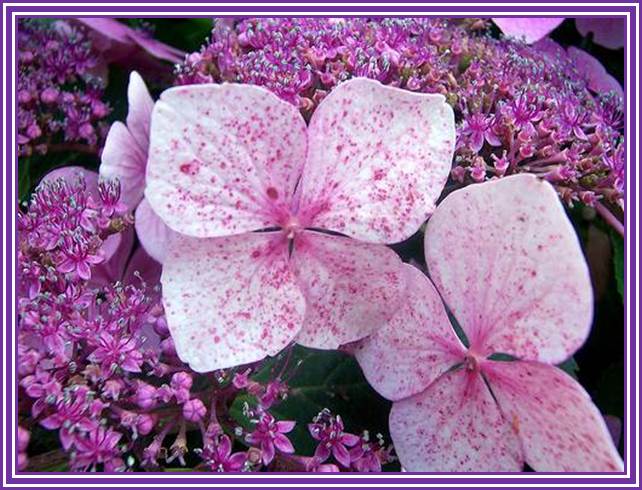
Codominant expression; youfrillme.com/tag/flowers

Codominance;
https://www.ck12.org
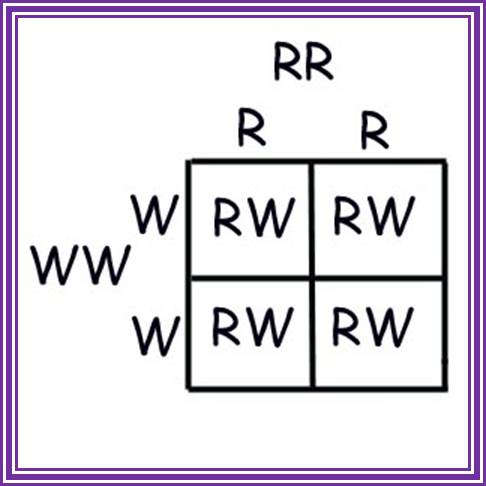

R = allele for red
flowers; W = allele for white flowers; red
x white ---> red & white spotted;
RR x WW ---> 100% RW; RED Flower x White Flower---> PINK Flower; Co dominance- blood groups; https://en.wikipedia.org
Gene Polymorphism:
A gene endowed with its
nucleotide sequence often undergoes changes by incorporation or deletion or
duplication of a set of nucleotides, thus genes exhibit polymorphism, and
examples are Ig genes and MHC class genes.
Pharmacogenetics- study of inherited variation in response. It refers to germ line mutations not to epigenetics. http://pganddrugresponse.blogspot.com
Model of pathways regulated by polymorphic genes that influence both innate and adaptive immunity following Leishmania donovani infection in the Sudan: SLC11A1 regulates macrophage activation with direct effects on innate antimicrobial activity, as well as pleiotropic effects on regulation of Th1 versus Th2 pathways. In the mouse, T cells are not required for early SLC11A1-mediated resistance to infection, but are essential to retain low parasite loads as infection progresses. Polymorphism at IL-4 also contributes to the underlying susceptibility to clinical VL in the Sudan, whereas polymorphism at IFNGR1 only influences development of PKDL. Since Treg cells producing both IFN-γ and IL-10 have been identified in patients drug-cured from VL [34], and high levels of IL-10 are observed in the skin of PKDL patients [35], we hypothesize that reduced functionality of IFNGR1 allows the down regulatory activity of IL-10 to predominate, leading to the recrudescence of parasites in remote sites in the skin. There are many more points along these pathways (e.g. polymorphism at genes encoding IFN-γ, IL-1β, IL-10, IL-13, and receptors for these cytokines) for which polymorphic variants might also contribute to overall disease phenotype and severity. Larger sample sizes will be required for genetic analysis to dissect out the roles of different polymorphic variants in determining disease severity, and to establish risk factors associated with multilocus genotypes across the contributing loci. Abbreviations: DC, dendritic cell; IFN-γ, interferon γ; IFNGR1, type I receptor for interferon γ; IL-10, interleukin 10; IL-10R, receptor for IL-10; hi, high level of expression or activity; lo, low level of expression or activity; Mφ, macrophage; PKDL, post-kala-azar dermal leishmaniasis; Th1 and Th2, T helper 1 and T helper 2 cells; Treg, regulatory T cells; VL, visceral leishmaniasis; X, block in pathway.

Genes which control hair color in mice are polymorphic; http://journals.plos.org
Sigle nucleotide polymorphism (SNP); This kind of polymerphism is due to change in single nmucleotides either in coding region, non coding region and intergeneic region. SNPs in the coding region are of two types, synonymous and nonsynonymous SNPs. Synonymous SNPs do not affect the protein sequence while nonsynonymous SNPs change the amino acid sequence of protein. The nonsynonymous SNPs are of two types: missense and nonsense.

SNPs in the coding region are of two types, synonymous and nonsynonymous SNPs. Synonymous SNPs do not affect the protein sequence while nonsynonymous SNPs change the amino acid sequence of protein. The nonsynonymous SNPs are of two types: missense and nonsense. SNPs that are not in protein-coding regions may still affect gene splicing, transcription factor binding, messenger RNA degradation, or the sequence of non-coding RNA. Gene expression affected by this type of SNP is referred to as an eSNP (expression SNP) and may be upstream or downstream from the gene. Application SNPs can be used for haplotype mapping. SNP density can be predicted by the presence of microsatellites: AT microsatellites in particular are potent predictors of SNP density, with long (AT)(n) repeat tracts tending to be found in regions of significantly reduced SNP density and low GC content. Variations in the DNA sequences of humans can affect how humans develop diseases and respond to pathogens, chemicals, drugs, vaccines, and other agents. SNPs are also critical for personalized medicine. SNPs' greatest importance in biomedical research is for comparing regions of the genome between cohorts (such as with matched cohorts with and without a disease) in genome-wide association studies.
Some SNPs are associated with the metabolism of different drugs. The association of a wide range of human diseases like cancer, infectious diseases (AIDS, leprosy, hepatitis, etc.) autoimmune, neuropsychiatric and many other diseases with different SNPs can be made as relevant pharmacogenomic targets for drug therapy. A single SNP may cause a Mendelian disease, though for complex diseases, SNPs do not usually function individually, rather, they work in coordination with other SNPs to manifest a disease condition as has been seen in Osteoporosis. All types of SNPs can have an observable phenotype or can result in disease:
SNPs in non-coding regions can manifest in a higher risk of cancer,[21] and may affect mRNA structure and disease susceptibility. Non-coding SNPs can also alter the level of expression of a gene, as an eQTL (expression quantitative trait locus).weekipedis.
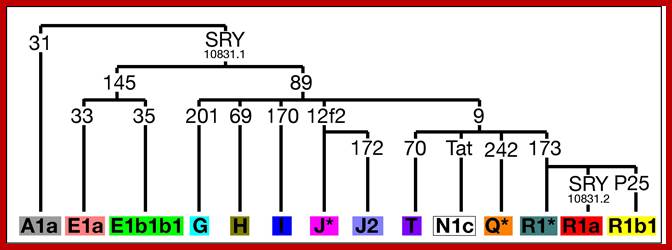
Single Nucleotide Polymorphisms (SNPs) are binary markers that can be identified in the DNA of the Y chromosome; they occur very rarely, so that two men sharing a particular SNP state in their DNA almost definitely inherited this from a shared ancestor, who may have lived many thousands of years ago. We type sets of SNPs, and use these to define Y chromosome types called haplogroups, which in turn can be arranged into a 'family tree', or phylogeny. If two men belong to different haplogroups, this excludes them from sharing a recent common ancestor. An example of a SNP is shown in the diagram below. http://www.le.ac.uk
What are Y-STRs?
Another type of marker on the Y chromosome consists of short units of DNA (typically 3 or 4 bases long) that are repeated in tandem several times (see diagram above). These are called short tandem repeats (STRs), or microsatellites; variation in these markers occurs much more frequently than at SNPs. Different Y chromosomes can carry varying numbers of repeats at a set of specific STRs, called a Y-STR haplotype. Haplotypes can be compared to identify differences between men within the same haplogroup. Related men will show the same or very similar patterns in terms of the numbers of repeats seen at a set of markers, while unrelated men will tend not to. In this study 17 Y-STRs were examined and a 17-locus haplotype was defined; in the example data sheet above, the haplotype is given under 'Microsatellites', and each is given a DYS number. http://www.le.ac.uk

The Y-phylogeny based on the markers we typed is shown below.
http://www.le.ac.uk/
On
the sheet that you received from us in 2004, your haplogroup, deduced from SNP
typing data, is indicated; in the example below, the Y chromosome belongs to
haplogroup I. http://www.le.ac.uk
DNA polymorphism: Variability in nucleotide sequence of specific DNA
segment, it can be a gene or not can be detected by restriction length fragment
analysis (RFLP), PCR. Examples of DNA polymorphism are VNTR, SNPs, short
tandem repeats (SATs) and many such insertions/deletions,; see figure below for
RFLP.

A polymorphism consisting of the presence or absence of a 250-bp DNA fragment was detected within the angiotensin I-converting enzyme gene (ACE) using the endothelial ACE cDNA probe. This polymorphism was used as a marker genotype in a study involving healthy subjects, whose serum ACE levels were concomitantly measured.
DNA gel-blot hybridization experiments with the Ban I-Ban I restriction fragment of the ACE cDNA. Genomic DNA digestion of members of a nuclear family by the restriction enzyme HinDIII.; DNA from the father, mother, and two children are shown, respectively, in lanes 1, 2, 3, and 4. DNA fragment sizes, in kilobases, are indicated by numbers on the right.
Multiple genes: (quantitative factors), QTL:
Heather C. Rowea,1,Bjarne Gram Hansenb,1, Barbara Ann Halkierb and Daniel J. Kliebensteina
Skin color, hair color, height and many others are quantitative. For a given trait there can be multiple factors that are inherited for they are located in different chromosomes. Random segregation and independent assortment provides this variation in quantitative characters.

Differences among individuals for most quantitative or complex traits such as reading ability are distributed as a normal bell-shaped curve. Multiple genes influence complex traits as probabilistic propensities rather than predetermined programs. Here the different genetic make-up of individuals with respect to two hypothetical genes involved in reading ability is shown for 100 individuals (each person is represented by an oval), with five of these individuals (those on the extreme left) receiving a diagnosis of reading disability. The green ovals indicate that the individual has the disabling variant of one gene and blue ovals denote the disabling variant of the other gene. Neither gene is necessary or sufficient for low scores, even for individuals who have disabling variants of both genes (red ovals). This QTL perspective suggests that genes associated with common disorders such as reading disability may represent the quantitative extreme of the same genes that are responsible for variation throughout the population Genetics and general cognitive ability, Robert Plomin; Robert Plomin http://www.nature.com
Nearly 210 lines of an Arabidopsis population that was previously used for targeted metabolite quantitative trait locus (QTL) and global expression QTL analysis. There are differences in the power to detect QTLs between transcript and metabolite traits. The distribution of metabolite QTLs across the genome included 11 QTL clusters; 8 of these clusters were associated in an epistatic network that regulated plant central metabolism. Quantitative trait analysis is enhanced by the use of microarray technology to measure global transcript levels in mapping populations and to map expression QTLs (eQTLs).
Polygenic inheritance (Maricopa) is a pattern responsible for many features that seem simple on the surface. Many traits such as height, shape, weight, color, and metabolic rate are governed by the cumulative effects of many genes. Polygenic traits are not expressed as absolute or discrete characters, as was the case with Mendel's pea plant traits. Instead, polygenic traits are recognizable by their expression as a gradation of small differences (a continuous variation). The results form a bell shaped curve, with a mean value and extremes in either direction.
Height in humans is a polygenic trait, as is color in wheat kernels. Height in humans is NOT discontinuous. If you line up the entire class a continuum of variation is evident, with an average height and extremes in variation (very short [vertically challenged?] and very tall [vertically enhanced]). Traits showing continuous variation are usually controlled by the additive effects of two or more separate gene pairs. This is an example of polygenic inheritance. The inheritance of EACH gene follows Mendelian rules.


The role of many genes (polygenic inheritance) in production of a continuum of phenotypes. Images from Purves et al., Life: The Science of Biology, 4th Edition, by Sinauer Associates (www.sinauer.com) and WH Freeman (www.whfreeman.com), used with permission. http://physics.scsu.edu
Usually polygenic traits are distinguished by-
- Traits are usually quantified by measurement rather than counting.
- Two or more gene pairs contribute to the phenotype.
- Phenotypic expression of polygenic traits varies over a wide range.
Human polygenic traits include-
- Height
- SLE (Lupus) (click here for an article about lupus and genetics)
- Weight (click here for an article about obesity and genetics)
- Eye Color (click here for an article about eye color)
- Intelligence
- Skin Color
- Many forms of behavior
Click here to view graphics about human polygenic inheritance from McGill University's Genetics pages.
Pleiotropic Genes:
Pleiotropy (Maricopa) is the effect of a single gene on more than one characteristic. An example is the "frizzle-trait" in chickens. The primary result of this gene is the production of defective feathers. Secondary results are both good and bad; good include increased adaptation to warm temperatures, bad include increased metabolic rate, decreased egg-laying, changes in heart, kidney and spleen. Cats that are white with blue eyes are often deaf, white cats with a blue and an yellow-orange eye are deaf on the side with the blue eye.
Sickle-cell anemia is a human disease originating in warm lowland tropical areas where malaria is common. Sickle-celled individuals suffer from a number of problems, all of which are pleiotropic effects of the sickle-cell allele. When a single gene affects the expression of more than one phenotypic character, the phenomenon is known as Pleiotropy (from the Greek pleio meaning "more" and "trop).
- Example:
Albinism.
A single defect in one of the enzymes catalyzing tyrosine (through many intermediate products) to melanin can affect multiple phenotypic characters, from eye color to skin color to hair color. - Another
Example - Sickle Cell Anemia
The mutation which changes the 6th amino acid from the terminal end of the Beta-protein chain is changed from glutamate to valine, making the chain hydrophobic rather than hydrophilic. Because the mutant hemoglobin precipitates readily in slightly acid conditions (as when the sufferer undergoes physical exertion, dissolving CO2 in the blood), and the malformed rbc's clog the capillaries, causing multiple phenotypic problems: - malformed red blood cells
- slowed blood flow due to malformed rbc's
- "tower skull" phenotype due to hypertrophy of red marrow in the cranium
- stunted growth
Number of genes:
DNA content of organisms varies from as small as 3 to 5 KB ssDNA to ds DNA with 10^12 bp. Paris (Pieris) rosea, an angiosperm contains about 52.3pg of DNA. Larger the genome, larger is the size of noncoding DNA; such as highly repetitive sequences. Genes are counted on the basis of how much of DNA codes for known products such as proteins and many types of RNAs. The number of genes coding for non-proteins such as rRNA genes, tRNA genes, 5S RNA and sn and sc RNA genes, have been more or less accounted with certainty. DNA-DNA hybridization studies using Cot curves and Cot1/2 values have provided a rough estimate of unique sequence, moderately repetitive sequences and highly repetitive DNA sequences; hundreds species have been accounted for. Based on kinetic complexity estimates, it is now possible to determine the total number of genes encoded by the genome. Using RNA driven saturation hybridization studies, approximate number of genes expressed in a given cell type or tissue can be estimated. In the past few years research workers are using high density microarray or expression system microarray, DNA arrays or RNA arrays; which are more sensitive and to some extent they are more reliable to quantitative estimation genes.
A list of genomes as samples, their sizes and approximate number of genes:
Viral RNA Genomes:
|
Species |
Shape-n-size |
Genome size |
Gene numbers |
|
RNA phages:
|
|
|
|
R17 |
Icosahedral |
|
|
|
MS2 |
Icosahedral |
4220 ntds, Linear |
4-5 |
|
F2 |
Icosahedral |
|
|
|
QB |
Icosahedral |
4120 ntds, Linear |
4-5 |
|
Plant viruses: |
|
|
|
TMV |
Rod shaped |
6782ntds, Linear |
4 |
|
ToMV |
Rod shaped |
6782 ntds, Linear |
4 |
|
Animal viruses: |
|
|
|
|
Reo |
Icaso, 25-30nm, naked |
Ds 10 segments |
10 |
|
Picorna virus;
|
Icosahedral, NE |
7400ntds (+) sense |
|
|
Rhabdo virus; VSV and Rabies |
Bullet shaped, Env |
7000-8000ntds, Ss RNA, (-) sense |
|
|
Orthomyxo virus; Influenza |
100nm,Env |
8 segments, ss RNA (-0 sense |
8 genes, 10 proteins |
|
Retroviruses |
Icaso, 100nm |
7k to 9k ntds, ssRNA,(+)sense |
4-5 |
|
Hapatitis delta Virus |
|
1700ntds, ssRNA (+)sense |
1 |
|
Calci virus |
|
7700ntds, ssRNA(+) sense |
3 |
|
Astro viruses |
|
6800ntds, ssRNA (+) sense, |
3 |
|
|
|
|
|
|
|
|
|
|
Viral DNA genomes:
Species |
Shape and size |
Genome size,
|
Gene numbers |
|
Bacteriophages: |
|
|
|
Phi X 174 |
Icasohedral, related are s13 And G4 |
5386ntds, ss- DNA, circular |
11 |
|
M13 |
Filamentous, Fd, f1 |
M13=6407 Fad=6407 F1=6408 Ss DNA, circular |
7 |
T2, T4, T6 phage |
Head and tail |
T4=166kbp, ds linear |
|
|
T3, T5, T7 |
Head and tail |
T5=113kbp T7=39.9kbp Ds linear |
>40 |
|
Lambda |
Head and tail |
48502bp,ds-linear |
50 |
|
P1 |
Head and tail |
88kbp, ds, linear |
|
|
P4 |
Head and tail |
11600bp, ds, linear,
|
|
|
Plant viruses: |
|
|
|
|
Gemini viruses- ToLCV |
Isometric, twins |
>2.6kb, ss DNA, Circular |
2-3 |
|
Cucumber leaf curl virus |
|
|
|
|
|
|
|
|
|
|
|
|
|
|
Animal viruses: |
|
|
|
SV 40 |
Isometric, NE |
5243bp,ds-circular |
2 genes and 5 proteins |
|
Polyoma |
Isometric, NE |
5256 bp? ds- Circular |
2 genes and 6 proteins |
|
Baculo virus |
Env, |
120-130bp, ds- Circular |
|
|
Hapatitis-B |
Isometric |
3182bp, circular R, ds, gapped |
|
|
Adeno virus |
Isometric, NE |
35937bp,ds- Linear |
~30 |
|
Parvovirus |
Isometric |
4700-5200bp,ds- Linear |
|
|
Papova virus |
Isometric NE |
4.5-7.5kbp,ds- Linear |
|
|
Herpes virus Simplex |
Isometric, Env |
80-113kbp,ds- Linear |
|
|
Poxvirus; Vaccinia |
240-300kbp,ds- Linear |
240-300kbp, ds-linear |
|
|
Epstein Barr virus |
|
1.72x10^5bp, ds-linear |
|
Prokaryotic genome size and gene numbers (few):
Species |
Genome size In bp |
Chromosome Number |
Gene numbers |
|
Mycoplasma geniculatum |
5.8x10^5 |
1 |
~470 |
|
Rikettsia prowazeskii |
1.2x1065 |
1 |
|
|
Methanococcus jannaschii |
1.7x10^5 |
1 |
|
|
Homophilus influenza |
1.830x10^6 |
1 |
1743 |
|
Mycoplasma pneumoniae |
5.8x10^5 |
|
|
|
Synechocystis (cystobacteria) |
3.570x10^5 |
1 |
|
|
Pyronema salina |
6.6x10^5 |
|
|
|
Bacillus subtilis |
2.1x10^6 |
1 |
|
|
Escherichia coli |
4.6x10^6 |
1 |
4288 |
|
Salmonella typhimurium |
1.1x10^7 |
1 |
|
|
Mycobacterium |
4.41x10^6 |
1 |
4000 |
|
Heliobacter Pylori |
1.667x10^6 |
1 |
1590 |
|
Chloro archinophyte |
3.8x10^5 |
1 |
|
|
|
|
|
|
|
|
|
|
|
A List of species and their haploid chromosome Numbers:
Animal’s chromosomal numbers(few):
|
Name of the species |
Haploid =n |
Homo sapiens |
23 |
|
Macaca mulata (Rhesus monkey) |
21 |
|
Cannis familiaris (Dog) |
39 |
|
Felis catus (cat) |
19 |
|
Equs calibus (Horse) |
32 |
|
Equs asinus (Donkey) |
31 |
|
Mus musculus (mouse) |
20 |
|
Rattus norvigicus (rat) |
21 |
|
Oryctologus caniculus (rabbit) |
22 |
|
Rana pipens (frog) |
13 |
|
Musca domestica (house fly) |
6 |
|
Drosophila melanogaster (fruit fly) |
4 |
|
Culex pipens (mosquito) |
3 |
|
Blata germanica (cockroach) Male- Female- |
11 12
|
Animals: genome size and gene numbers(few):
Species |
Genome size In bp |
Haploid number |
Gene numbers |
Cryptophyte |
6x10^5 |
3 |
|
|
Coeno rhabditis |
8x10^7 |
|
13000 |
|
Drosophila melanogaster |
1.65x10^8 |
4 |
5000 |
|
House fly |
8.6x10^8 |
|
|
|
Plasmodium falciform |
2.7x10^7 |
|
5885 |
|
Gallus Domesticus, (Chick) |
1.2x10^9 |
|
|
|
Mus musculus |
2.7x10^9 |
|
25000 |
|
Rattus norvigeticus |
3x10x^9 |
|
|
|
Frog |
2.3x10^9 |
|
|
|
Xenopus laevis |
3.1x10^9 |
|
25000 |
|
Danio revio (zebra fish) |
1.7x10^9 |
|
|
|
Sea urchin |
8.0x10^8 |
|
|
|
Homo sapien XY= XX= |
3x10^9 3.2x10^9 |
|
21000 24000 |
Lung fish |
1.02x10^11 |
|
|
Plants chromosomal numbers (few):
|
Name of the species |
Haploid number (N) |
|
Chlamydomonas reinhardii (green algae) |
8 |
|
Allium cepa |
8 |
|
Phaseolus sativum (French beans) |
7 |
|
Pisum sativum |
7 |
|
Hordeum vulgare |
7 |
|
Vicia faba (broad beans) |
6 |
|
Lycopersicon esculentum (tomato) |
12 |
|
Nicotiana tabaccum (tobacco) |
24 |
|
Gossipium hirsutum (cotton) |
26 |
|
Oryza sativa (rice) |
12 |
|
Triticum aestivatum (wheat) |
21 |
|
Zea mays (corn) |
10 |
|
Antirrhinum majus (snap dragon) |
8 |
|
Pinus sylvestris (Pinus) |
12 |
|
Phaseolus vulgaris (kidney bean) |
11 |
|
Solanum tuberosum (potato) |
24 |
|
Yeast (S.cerviciae) |
17 |
|
Actabularia mediterranica |
10 |
|
Dictyostelium discoideum |
7 |
|
Aspergillus nidulens |
8 |
|
Neurospora crassa |
7 |
|
Penicillium notatum |
4 |
|
|
|
|
|
|
Plant genome size and gene Numbers:
|
Species |
Genome size |
Haploid number |
Gene numbers |
Neurospora crassa |
2.7x10^7 |
7 |
|
|
Saccharomyces cerviciae |
1.3x10^7 |
17 |
|
|
Dictyostelium discoideum |
5.4x10^7 |
7 |
|
|
Arabidopsis thaliana |
1.45x10^8 |
5 |
23000 |
|
Prunus persica |
2.62x10^8 |
|
|
|
Ricinus Communis |
3.2x10^8 |
|
|
|
Oryza sativa |
4.8x10^8 |
12 |
|
|
Petunia |
1.221x10^9 |
|
|
|
Zea mays |
3.9x10^9 |
10 |
25-30000 |
|
Pisum sativum |
3.947x10^9 |
7 |
|
|
Avena sativum |
1.1315x10^ |
|
|
|
Tulipa |
2.4x10^10 |
|
|
|
Lily |
3.0x10^11 |
|
|
|
|
|
|
|
Organelle Number and genome size:
Chloroplasts:
|
Species |
Genome Numbers per Organelle |
Genome size |
Organelle Numbers per Cell |
Chlamydomonas |
80 |
180kbp,circular, ~100 to 120 genes |
1 |
|
Maize |
20-40 |
120-200 kbp, circular, 100-120 genes |
20-40 |
|
Liverwort |
|
120000,circular |
|
|
Tobacco |
|
155.844KBP, circular |
|
Mitochondria:
|
Species |
Organelle numbers |
Genome size |
Genome number per organelle |
Gene numbers |
Homo sapien |
1000/cell |
16.5kbp, circular |
5-10 |
13 ORF 7 URF |
|
S.cerviciae |
100-200/cell |
84kbp, circular, contain introns |
2-50 |
13 ORF 7 URF |
|
Plants |
|
1.5x10^5 2.5x10^6, Circular, Contain introns |
5-10 |
13 ORF 7 URF |
|
Neurospora |
|
19-108kbp, Circular, contain introns |
6-10 |
|
|
Chlamydomonas |
|
16000bp, Linear |
1 |
13 ORF |
Species Name ,Genome size in (Mb):
Number of genes astoundingly variable, but the question is how many genes are essential for life? (Craig Venter)
It is generally an accepted fact that the total number of genes in an organism depends upon the total size of the unique class or what is called non-repetitive class of DNA, repetitive rRNA and tRNA gene are essential. Even on this basis if one calculates, the number one can arrive at the number is often misleading. In recent years, persons working on genome project, made a rough estimate that can account for all functions as 100,000 to 120 000, but the actual number obtained by the human genomic group is roughly 21000 to 24000, which is five time less than the predicted number. “If science and scientific methods and predictions on such basis, are often mislead them, it is difficult to believe in people who practice science”. Such statements of mine are stupid, for molecular genetics is still evolving.

Craig Venter; Born in 1946 , The Great.
In this mess of things, if one asks, what is the exact number of genes required for an organism to live and let live and propagate and occasionally produce variations. Recombination can generate new segments of DNA. Continuation of the gene confers selective advantage. Diploids have overwhelming advantage over haloids, for a single or few mutations in a species and in a population are tolerated for the mutants will have alleles, where the mutated gene’s wild type is still working. Mutations in an established gene can affect the function and it can disable the organism, but in some cases it can acquire new function. Null mutations can deleterious for the species, but gain mutation leads to new way of life.
“In order to estimate the essential number of genes, one can use mutational analysis. If one uses specific regions and saturate each of them with lethal mutations, the mutations should map into a number of complementation groups. By extrapolating this method to the genome as a whole one can or may calculate the number of essential genes. Craig Venter has achieved such task and has created a bacteria Mycoplasma genitalium containing just ~800 genes. Mycoplasma genitalium is a small parasitic bacterium that lives on the ciliated epithelial cells of the primate genital and respiratory tracts. M. genitalium is the smallest known free-living bacterium, and the second-smallest bacterium after the recently-discovered Endosymboint Carsonella ruddii. Until the discovery of Nanoarchaeum in 2002, M. genitalium was also considered to be the organism with the smallest genome. The genome of M. genitalium consists of 521 genes (470 predicted protein encoding genes) in one circular chromosome of 582,970 bp. Mycoplasma laboratorium is a planned partially synthetic species of bacterium derived from the genome of Mycoplasma genitalium. This effort in synthetic biology is being undertaken at the J. Craig Venter Institute by a team of approximately 20 scientists headed by Nobel laureate Hamilton Smith, and including DNA researcher Craig Venter and microbiologist Clyde A. Hutchison III. On Oct 6, 2007, Craig Venter announced in an interview with UK's The Guardian newspaper that the same team had synthesized a modified version of the single chromosome of Mycoplasma genitalium using chemicals. The chromosome was modified to eliminate all genes which tests in live bacteria had shown to be unnecessary. The next planned step in this minimal genome project is to transplant the synthesized minimal genome into a bacterial cell with its old DNA removed; the resulting bacterium will be called Mycoplasma laboratorium. The next day the Canadian bioethics group, ETC Group issued a statement through their representative, Pat Mooney, saying Venter's "creation" was "a chassis on which you could build almost anything". The synthesized genome had not yet been transplanted into a working cell.
On May 21, 2010, Science reported that the Venter group had successfully synthesized the genome of the bacterium Mycoplasma mycoides from a computer record, and transplanted the synthesized genome into the existing cell of a Mycoplasma capricolum bacterium that had had its DNA removed. The "synthetic" bacterium was viable, i.e. capable of replicating billions of times. The team had originally planned to use the M. genitalium bacterium they had previously been working with, but switched to M. mycoides because the latter bacterium grows much faster, which translated into quicker experiments. Venter describes it as "the first species.... to have its parents is a computer". The transformed bacterium is dubbed "Synthia" by ETC. A Venter spokesperson has declined to confirm any breakthrough at the time of this writing, likely because similar genetic introduction techniques such as transfection, transformation, transduction and protofection have been a standard research practice for many years. Scientists in Scripps Research Institute in San Dieogo (Joyce Laboratory) created a molecule RNA called it “The Immortal Molecule” which plays Robin to DNA’s Batsman in life; ‘the RNA is capable copying itself in test tube over and over again and evolving’.
Watermarks:
A much publicized feature of the M. laboratorium is the presence of watermark sequences as an ultimate proof of the achievement and as a publicity stunt — it's a common tradition in the semiconductor industry to have Latin inscriptions in unused portions of the microchip, visible only by electron microscopy. The 4 watermarks in the form of DNA base pairs, of 1246, 1081, 1109 and 1222 base pairs respectively, in natural peptides the 4 nucleotides encode in sets of 3 the 20 natural amino acids by means of the universal genetic code. Each amino acid by convention is represented by a letter, but in nature there is nothing which ties Alanine, a molecule, to the Latin letter A, a vowel, so this convention was disregarded in the latter watermarks. In the minimal genome organism the watermark were encoded as amino acids, with V as U, both in reference to Latin inscriptions and the lack of a standard amino acid for U containing the names of the researchers:
§ VENTERINSTITVTE
§ CRAIGVENTER
§ HAMSMITH
§ CINDIANDCLYDE
§ GLASSANDCLYDE
In the synthetic organism, instead the Latin alphabet — which in English has 26 letters, which is covered only in base 4 with 3 or more digits — was encoded by a undisclosed encoding. The encoding is fixed and 3 digits make an uppercase letter or Ascii symbol, possibly randomly allocated (not Ascii table, frequency or keyboard order). The content of the watermarks is as follows, from Wikipedia.
1. Watermark 1 an Html script which reads to a browser as text congratulating the decoder with an email link (mroqstiz@jcvi.org) to click to prove the decoding.
2. Watermark 2 contains a list of authors and a quote from James Joyce: "To live to err, to fall, to triumph, to recreate life out of life".
3. Watermark 3 contains more authors and a quote from Robert Oppenheimer (uncredited): "See things not as they are, but as they might be".
4. watermark 4 contains yet more authors and a quote from Richard Feynman: "What I cannot build, I cannot understand"
· In the case of fruit flies, analysis has been made, because they have countable chromosomal bands, which are always found in specific loci and accounted for certain, characteristics. Using these methods, it is physically possible to identify and count the bands. Counting has given a rough estimate of 5000 bands encompassing 4 chromosomes.
Each band is estimated to have 20 kbp as an average size. By analyzing lethal genes at each of the bands, it is calculated that 70% of the bands account for essential genes. On this basis, it is estimated that total number of lethal genes applied to chromosomal bands is about 3600 that means that is the number of genes essential for life.
According to some estimates the essential number is 11,000? But this number has been messed up because of the accounting of gene numbers in human beings, so error prone, which is human; so one has to take this numbers with a pinch of salt.
-0-