Tissue Specific Expression and Copy Numbers:
Expression of genes, in a given system, and cell type specific in a given tissue; many of them are expressed in stage specific manner, some only once in a life time of the cell or they are expressed in response to stimulus; some are expressed all the time. Ribosomal RNA, tRNA, Sc/Sno and many ncRNAs represent their own genes. As mRNAs actually represent an expressed gene, it is easy to obtain the data. Among them a large numbers are expressed as housekeeping genes and many in tissue specific manner. Estimate of each kind can be made by re-association kinetics.
One can obtain total mRNA (Poly-A containing RNA) and they can be reverse copied into labeled cDNA, which can be hybridized to far excess amount of non-repetitive DNA (now it is possible to obtain non-repetitive DNA in absolutely pure state). The DNA: RNA hybrids can be recovered either from nitrocellulose membranes or from hydroxyl apatite columns and the same can be quantified using reassociation kinetics.
In the above said methods, the kinetic reactions are of pseudo first order for one of the reactants used is in far excess. Such reaction are considered as DNA driven reaction or if excess RNA is used, it can be called RNA driven reaction; so they can be expressed in terms of Cot or Rot values, Cot for DNA driven and Rot for RNA driven reactions respectively. The Cot or Rot curves can be obtained by plotting the fractions (percentage of DNA: RNA hybrids or RNA: cDNA hybrids) recovered as the function of Cot or Rot values, which are expressed in mole L1, S1.
Rate = K [A] = K (a-x),
D X /DT = K (a-x),
Or dx / dt = -KC.
D/Do = -K.Cot,
This is another form of expression.
Where Do is the concentration at zero time and D is the concentration after a period of reaction. By plotting the values one can obtain Rot curves, Rot values and Rot ½ values.
If D /Do = 0.5 i.e. Half way through the reaction time,
So K = ln2 / K.t ½, where ln is the natural log of 2. And K is the rate constant.
For calculation purpose let us use sea urchin genome as an example. The genomic size of it is 8.1 x 10⁸ bp (n value). Non-repetitive DNA of its genome is 70-75% (something wrong with the book I referred, for no eukaryote can contain 75% Nonrepetitive DNA). A small amount of non-repetitive DNA (labeled with *P32) is hybridized with far excess amount of total purified mRNA, (say here it is poly-(A) containing RNA) extracted from a given tissue. This reaction is RNA driven. This reaction saturates at 300 Cot value. The percent of the DNA that is hybridized by the RNA is 1.35%; as only one of the DNA strand is used in reassociation reaction, calculating for ds DNA reaction, the amount of DNA hybridized can be taken as 2.7% (1.35x2).
Genome size is 8.1x10^8bp,
And 75% of the genome is non-repetitive- 8.1 x 10^8 x 0.75 = 6.075 x 10^8 bp,
Hybridization of NR DNA with excessive labeled mRNA reaches saturation with cot/rot value of 300 and percent of NR DNA hybridized is 1.35. This value of 1.35 is for single strand, so double it for double strand; so the value will be 2.7.
So 2.7 % of non-repetitive DNA (6.05x10^8bp) amounts to-
6.075 x 10^8 x 0.027 = 1.64 x 10^7 bp.
This is the total length of the DNA that is transcribed in that tissue. Considering the average length of an mRNA is about 2000 ntds long, the total number of genes expressed is- 1.64x10^7bp divided by 2x10^3 = 8021. This is wrong deduction for the hybridized region also contains UTRs and Introns, but introns loop out. But we can take it RNA hybridized to only to the exon region of the DNA.
This kind of quantification of number of genes expressed is an approximate estimate, of course, with some experimental errors notwithstanding. It is still more or less an accurate value. The said experimental protocols can be used for any tissue of any organism. It has been estimated, from various sources, that in any given tissue, at any given point of time, the total number of genes expressed is roughly 1.8 or little less of the total genome present.
Abundance of mRNAs expressed:
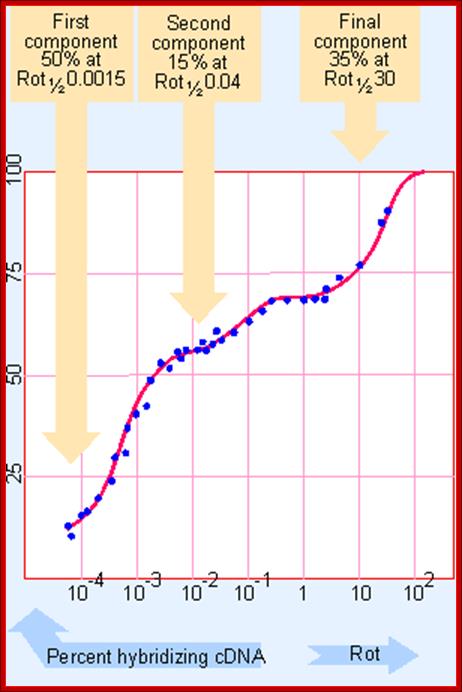
It is not only the number of genes expressed differs from one tissue to the other, even each of the RNA species expressed; their copy number or abundance of them varies. This can be determined by taking purified total mRNA from, for an example a pregnant chick oviduct; and it is reverse transcribed with Reverse Transcriptase with radioactive isotopes to obtain full length cDNA. Then hybridize the labeled cDNA to excess quantity of total mRNA (at least 1000 times the quantity of cDNA). The re-association reaction is expressed graphically. The Rot curves obtained look more or less similar to Cot curves and contain three kinetic components. The first and second components are distinctly different, but second and the third are clearly not distinguished from each other. From such curves it is possible to obtain Rot ½ values for each component.
From the graphic expression it can be discerned that the first component is the fast one, second is moderately fast and the third is slower component.
How many genes are there? GENES IV; Hybridization between excess mRNA and cDNA identifies several components in chick oviduct cells, each characterized by the Rot 1/2 of reaction. http://genes.atspace.org/
Calculating the Kinetic Complexity of Each Component:
From this data one can obtain kinetic complexity of each of the components and frequency of each species (that is copy numbers) can be determined. This can be done by dividing Rot1/2 of a specific component by Rot1/2 of standard Ovalbumin (Rot1/2 of Ovalbumin mRNA is 0.0008).
Fast: 0.0015 x 0.5 x 2000 / 0.0008 = 1875 bp long.
Moderate: 0.04 x 0.15 x 2000 / 0.0008 =15000 bp.
Slow: 30x0.35x2000 / 0.0008 = 26525 000 bp.
Note-Rot ½ of fast, moderate and slow are 0.0015, 0.4 and 30 respectively. The proportion is 50%, 15% and 35% respectively. Cot ½ of ovalbumin mRNA is 0.0008.
Determining Number of Species From Each Component:
From this data one can determine copy numbers of each of the components. Divide kinetic complexity by the average length of an mRNA. In this case the average length of the mRNA is taken as 2000 ntds.
First: 1875 / 2000 = ~ 1 species.
Second: 15 000 / 2000 =~ 6 to 7 species.
Third: 26525 000 / 2000 = ~13262.5 species.
Determining the Number of Copies of Each Species:
Chick oviduct tissues contain a mass of 0.275 pg of mRNA per cell. If 1 pg of ds DNA is equal to = 0.978x10⁹ bp, then 0.275 pg (ss mRNA) x 2 is = 0.55pg, that is equivalent to the quantity of ds DNA (approximate). Now multiply 0.55 pg x 0.978 x 109 bp = 5.3075 x 10⁸ bp. Divide this number with different kinetic components and the percentage of the total mass of mRNA it accounts for the dividend is divided by the average number of mRNA length.
First: 5.3x 10^8 x 0.5 / 2000 = 132687
The copy number of the single species is 132687. Oviduct cells, of a pregnant chick’ produce Ovalbumin mRNA in large quantities; nearly 50% of the total mRNAs. Such examples are in abundance, ex. Islets of langerhans beta cells produce enormous amounts of insulin mRNA. mRNAs for Ribulose- biphosphate carboxylase’ (RuBpCASE’) large subunit is also produced in large quantity, its amount is more than 50% of the total mRNA in photosynthetic plant cells and their expression is shut off during nights or darkness. Such genes are expressed in tissue specific manner and expressed abundantly; so they are called Luxury genes.
Second: 5.3x10^8 x 0.15 / 15 000 = 5300 copies.
The total copy numbers obtained is 5300, but the second component accounts for 6 to 7 different species. If 5300 is divided by 6 or 7 (species) gives, the copy numbers of each species is 750 to 850 copies respectively. This can be due to multi gene and multiple allele family of gene expression. This kind of expression suggests the products are required in sufficiently large numbers. These can also be of tissue specific types.
Third: 5.3x10^8 x 0.3 / 26525 000 = ~ 6.1 copies
The total number of different species is 13125 and each species may be represented by one to 5 copies.
From the above data, one can discern that the first component is definitely tissue specific type expression and it is expressed in greater abundance. Even the second component appears to be tissue specific type, expressed in relatively large numbers. But the third component, it doesn’t give which of them are expressed as common for all tissues i.e. As housekeeping genes and which of them are tissue specific types, which is very important for determining the cell type and cell functions.
Distinguishing genes expressed as house keeping genes, as common for all tissues and those expressed in tissue specific manner (unique) or stage specific or induced manner is important. Generally the number of genes expressed in any tissue is approximately ~1.2 % of the non-repetitive DNA. The total number of genes expressed in all kinds of cell types is about 7000 to 22 000 or little more than it.
Chick livers express a total of ~15000 to 17000 genes. Chick oviduct expresses a total of ~13100 to 13200. Renature studies suggest that the genes expressed common for both tissues are about ~12000 genes and the other 5000 genes are specific to liver and 3000 genes are for oviduct.
Studies from different tissues and from different organisms, it is estimated that more than 80 to 90% or more of the genes expressed are house keeping genes. The rest are all tissue specific, among them few gene are expressed in very high copy numbers, for example in chick oviduct one species of Ovalbumin mRNA is more than 50% of the total mRNAs. It is possible to determine or estimate the genes expressed commonly to all cell types and those expressed in cell type specific manner, by any of the following methods. Additive saturation method, Subtractive method, M-DNA and null DNA method, Serial analysis of gene expression method (SAGE) method and High density oligonucleotide array method (HAD) are some of the methods employed for the above purpose.
Additive and Saturation methods:
· Use non-repetitive DNA from chick and hybridize with excess amount of mRNAs from liver to saturation.
· In another experiment, hybridize non-repetitive DNA with mRNAs from oviduct.
· In the third experiment the non-repetitive DNA is hybridized with mRNAs from both tissues.
· In the first experiment mRNAs from liver saturates at 2.04%.
· In the second experiment, mRNAs from oviduct saturates at 1.8%.
· In the third experiment saturation is not at 3.8% as expected but saturates at 2.4%.
· From this type of experiments it is calculated that liver and oviduct both express 12000 genes as common for both tissues, and livers specific expression is 5000 extra and oviduct specific 3000 in addition.
Subtractive method:
· Prepare labeled C-DNA from tissue A and similarly from tissue B.
· Hybridize “A” C-DNA with excess mRNAs from “B” tissue, and “B” C-DNA with excessive mRNAs from ‘A’ tissue to saturation.
· Then treat it with DNase free RNase.
· Isolate RNA: C-DNA hybrids, and unhybridized “A”-CDNA.
· Similarly isolate RNA: C-DNA hybrids and unhybridized “B” C-DNA from the B-preparations.
· From this experiment, it is clear that the unhybridized ss A, C-DNA is unique for A tissue and unhybridized ss B, C-DNA is unique for B tissue.
· The RNA: DNA hybrids are actually common to both.
· Unhybridized c-DNAs are unique to each of the said tissues.
· However this experiment does not give you the abundance of each category of genes expressed, but it can be estimated by reassociation kinetics.
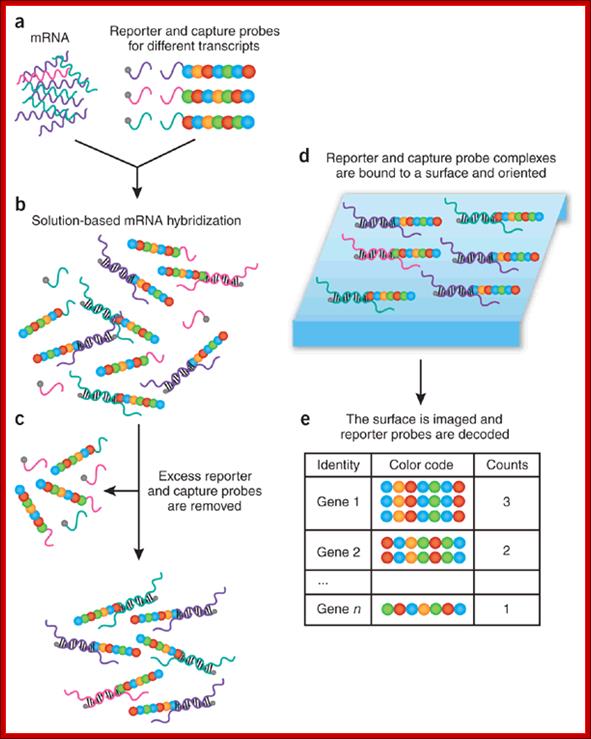
Color-coded probe pairs enable multiplexed gene expression analysis with a sensitivity that rivals PCR-based methods. High-throughput RNA expression profiling is generally carried out using microarrays1, 2 and real-time reverse transcriptase (RT)-PCR to validate differentially expressed genes3. Ideally, however, one would like a method that provides a direct digital readout of each mRNA and its relative abundance using a small amount of total RNA (100 ng) and without requiring cDNA synthesis or enzymatic reactions. Digital mRNA profiling; Paolo Fortina1 & Saul Surrey; http://www.nature.com/
Null and M- DNA:
Use a small amount of non-repetitive DNA and hybridize it with excess mRNA from tissue A.
The part of the DNA that hybridizes is called M-DNA and that is not hybridized is called Null DNA.
Isolate M-DNA and Null DNA (there are methods to isolate them). Then hybridize M-DNA to saturation with excess mRNA from B tissue and similarly hybridize Null DNA with B tissue mRNA.
The part of the M-DNA that gets hybridized is considered as the genome part that is commonly expressed, and that part of the M-DNA not hybridized is unique to A tissue.
The part of the Null DNA that gets hybridized is unique to B tissue.
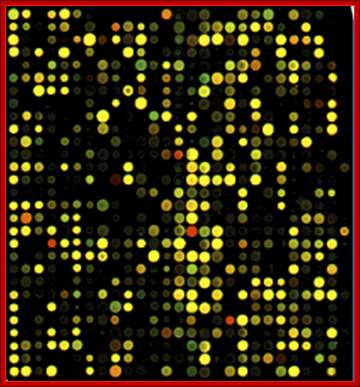
Micro-Array Method by Using DNA Chip:
In order to estimate the expressed genes and quantify each of the expressed genes one can use micro-array method. To perform this technique one has to have the complete knowledge of the genome and one has to have genomic library at hand. If one has the knowledge of the whole genome, it is easy to design 24-30 nucleotides long oligo's as unique sequences or combination of unique sequences from each of the genes and layer them on glass slides or by new methods it is possible to synthesize on the spot and organize the oligo’s for all the known genes and the oligo’s are fixed firmly to the glass plate or any other support used.
Then isolate total poly (A) containing RNAs form one tissue, call it “A” tissue and similarly isolate Poly (A) containing RNA from the other tissue call it “B”. These mRNA species represent the population of genes expressed and they also represent the quantity of each mRNA species, which range from 5-6 copies to 100 000 copies per a species. These mRNAs are copied to generate cDNA with florescent dyes, let us say the cDNAs from tissue A were labeled with Red dyes and Tissues from B were labeled with Green dyes.
Then micro plates were hybridized at stringent conditions for defined time and washed to remove unbound cDNAs. They are then scanned and analyzed by computer programs.
The B cDNA, it means the gene expressed is common to both tissues.
Gene expression during development;
Abundance of gene expression in different tissues as depicted by the micro array chips; this is of the degree of expression of each of the genes; a general representation. Debby Walser-Kuntz, et al; http://serc.carleton.edu
The principle is simple. One should know how many of oligo’s (in numbers) are placed at each spot and amount of mRNA used for hybridization, provides the quantity of the mRNA for a given gene. If the same spot is hybridized for both, the spot color would be yellow for when red and green are mixed one gets yellow color. If there are spots which fluoresce only red color or only green color, it means the red spot are from "A" tissue and green spots represent B tissue. The quantity of the florescence provides the quantity of the mRNA population of each of the species. Thus it is possible to screen tissue specific expression.
PCR Methods:
In recent years, with the availability of complete genomic data for specific species, it is possible design primers and the same can be used for quantitative analysis of specific transcript. Real time PCR and its related techniques are employed in quantification of each of the transcript species produced in tissue specific manner.
Beckman-Coulter has prepared a report on an experimental application using the GeXp system, which offers a complete review of the method and how it works. http://www.unbc.ca
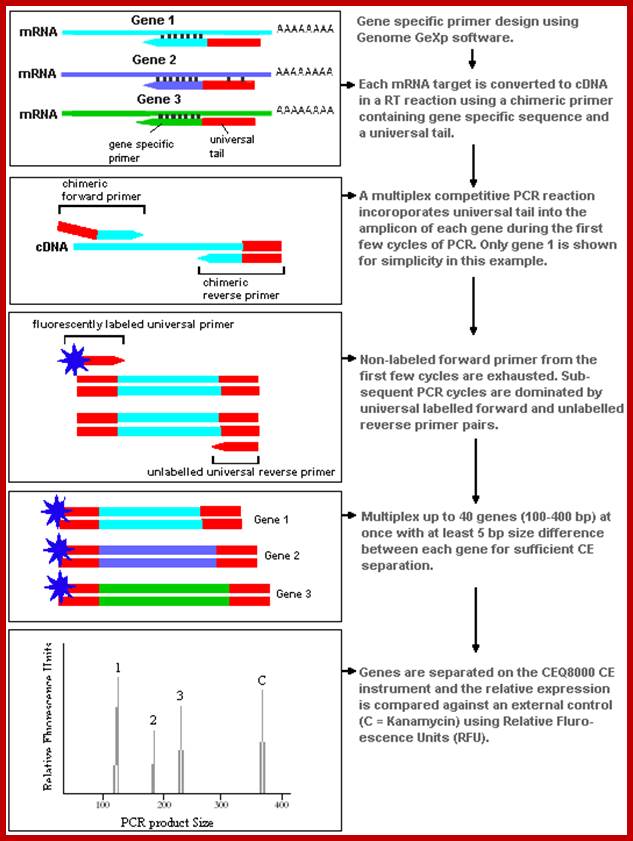
Genome GeXP
Beckman-Coulter's GeXP system is based on the procedures of Wang et al. (1998). The method uses a chimeric set of primers, with the forward part attaching to a gene specific region and a universal tail that is incorporated into the transcript during amplification. Primers are designed to target products ranging in size from 100-400 bp with a minimum 5 bp size separation between products. A dye labeled primer that attaches to the universal tail is added to the amplification process and competitive PCR amplifies the different genes with equal efficiency. Genes are separated by size during capillary electrophoresis and quantified by their relative fluorescent intensity. The flow chart image below shows how the GeXP method works through the cDNA synthesis and PCR phases.
Real-time PCR, also known as kinetic PCR, qPCR, qRT-PCR and RT-qPCR, is quantitative PCR method for the determination of copy number of PCR templates such as DNA or cDNA in a PCR reaction. There are two flavors of real-time PCR: probe-based and intercalator-based. Both methods require a special thermocycler equipped with a sensitive camera that monitors the fluorescence in each well of the 96-well plate at frequent intervals during the PCR Reaction.
PCR Amplification: http://www.promega.es/
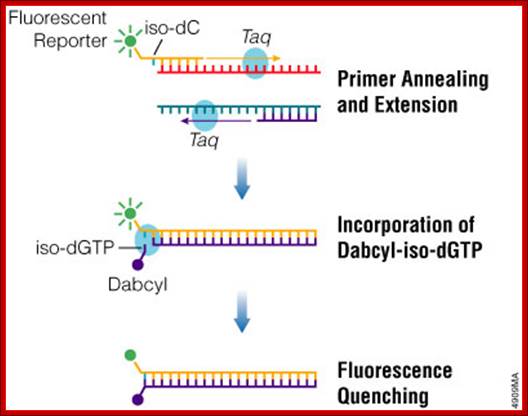
Probe-based real-time PCR, also known as TaqMan PCR, requires a pair of PCR primers as regular PCR does, an additional fluorogenic probe which is an oligonucleotide with both a reporter fluorescent dye and a quencher dye attached. Intercalator-based method, also known as SYBR Green method, requires a double-stranded DNA dye in the PCR reaction which binds to newly synthesized double-stranded DNA and gives fluorescence. TaqMan method is more accurate and reliable than SYBR green method, but also more expensive (from Protocol Online a reference book).